Intro
The Sysmon ProcessAccess event has been used in threat hunting and detection efforts in order to alert on techniques such as process injection and credential access.
According to the Sysinternals website, the Sysmon ProcessAccess event reports when a process opens another process, an operation that’s often followed by information queries or reading and writing the address space of the target process.
Johnny Johnson’s research into which APIs map to Sysmon events shows us that the Sysmon ProcessAccess event gets its information from the NtOpenProcess` and `NtAlpcOpenSenderProcess
We can also look at the Sysmon Community Guide for an explanation of the various fields contained in the Sysmon ProcessAccess event as well as a sample configuration file containing rules that correspond to this event.
A particular field of interest for this blog post is the CallTrace field, which, according the Sysmon Community guide, includes the DLL and the relative virtual address of the functions in the call stack right before the open process call
Very interesting indeed and leads to the question of whether we can extract any detection value out of this field.
With this in mind, the purpose of this blog post is to look at the above question and take a deeper dive into the Sysmon CallTrace field in order to demonstrate how it can be used for both writing Sysmon rules as well as hunting for particular TTPs.
Before diving in, it is important to note that hunting within the Call Trace field is not a brand new concept, Andrey Skablonsky presented on the topic for Zero Nights 2019. This presentation served as the inspiration for this blog post.
Methodology
A sample Sysmon Process Access event can be found here: https://www.ultimatewindowssecurity.com/securitylog/encyclopedia/event.aspx?eventid=90010 – taking a look at the CallTrace field, we see values like C:\Windows\SYSTEM32\ntdll.dll+a5594` and `C:\Windows\system32\KERNELBASE.dll+1e865
In order to extract value from these events and make them readable to humans, we need a way to look up these addresses and translate them to their corresponding functions.
There are probably numerous ways to accomplish this task, however, for the purposes of this post, WinDbg and Process Monitor will be used.
Using WinDbg, we need to either start the process we need to monitor via the debugger or start the process first and then attach a debugger to it. After doing so, a breakpoint needs to be set on the CreateUserProcess API call: bp ntdll!ZwCreateUserProcess
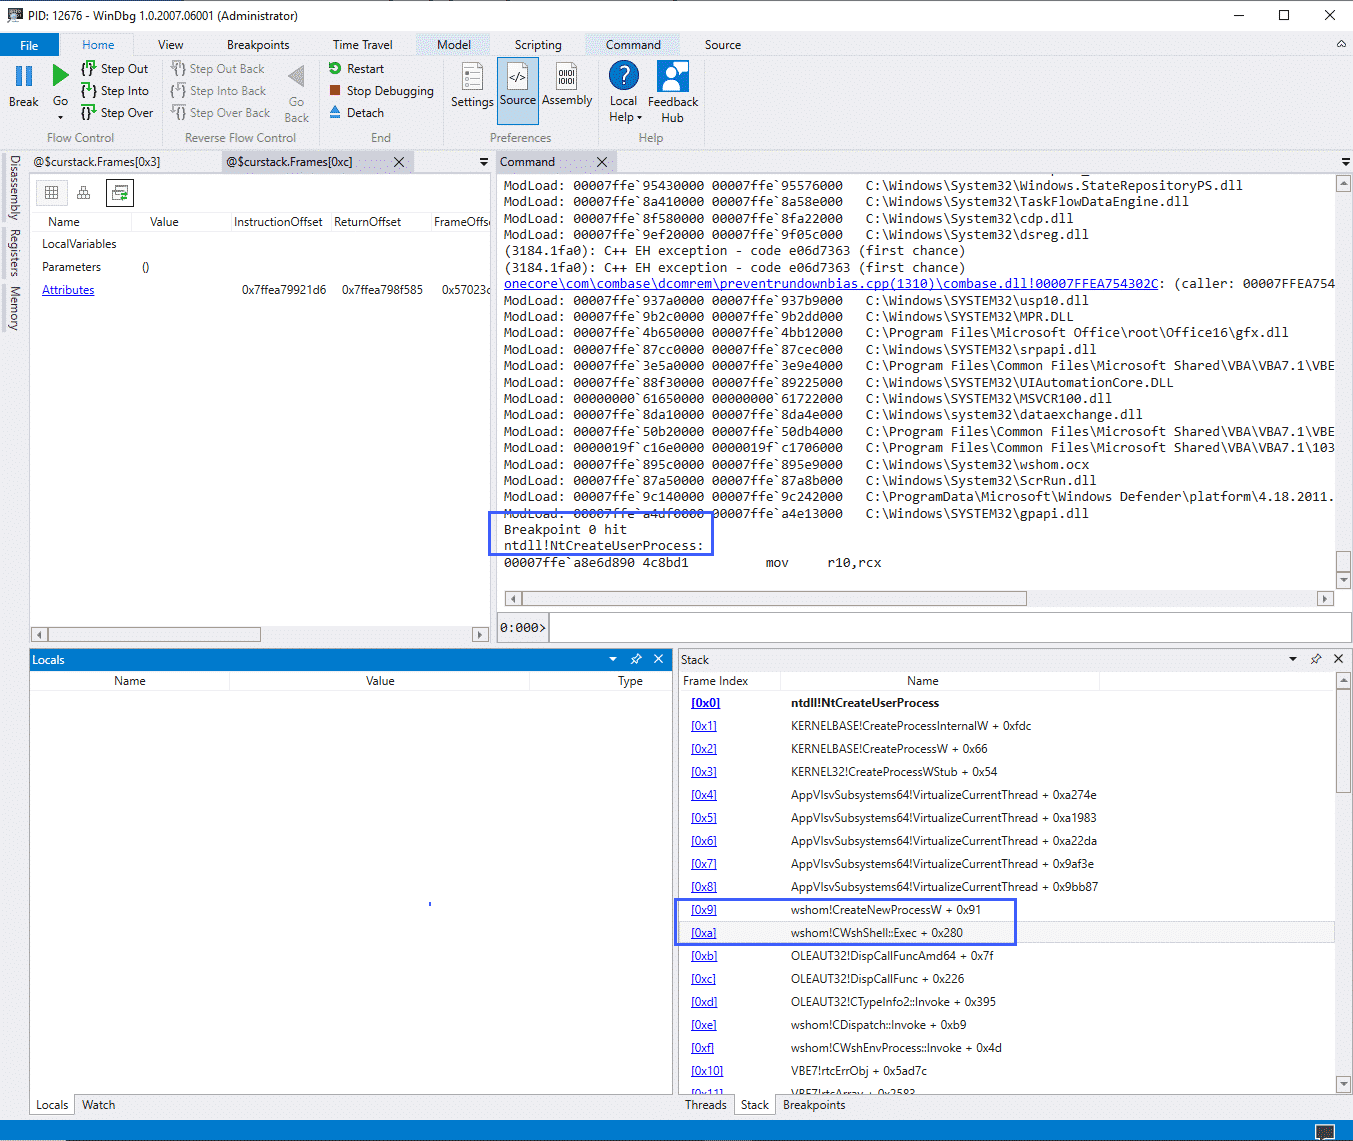
The screenshot above illustrates a debugger running, in this case attached to the WINWORD.exe process, with the breakpoint highlighted above it.
The "Stack" window shows us the same values as would be found in the CallTrace field of the Sysmon ProcessAccess event, however, we can see that WinDbg has translated the function calls for us.
The Process Monitor "Stack Summary" can also be used to translate call trace values:
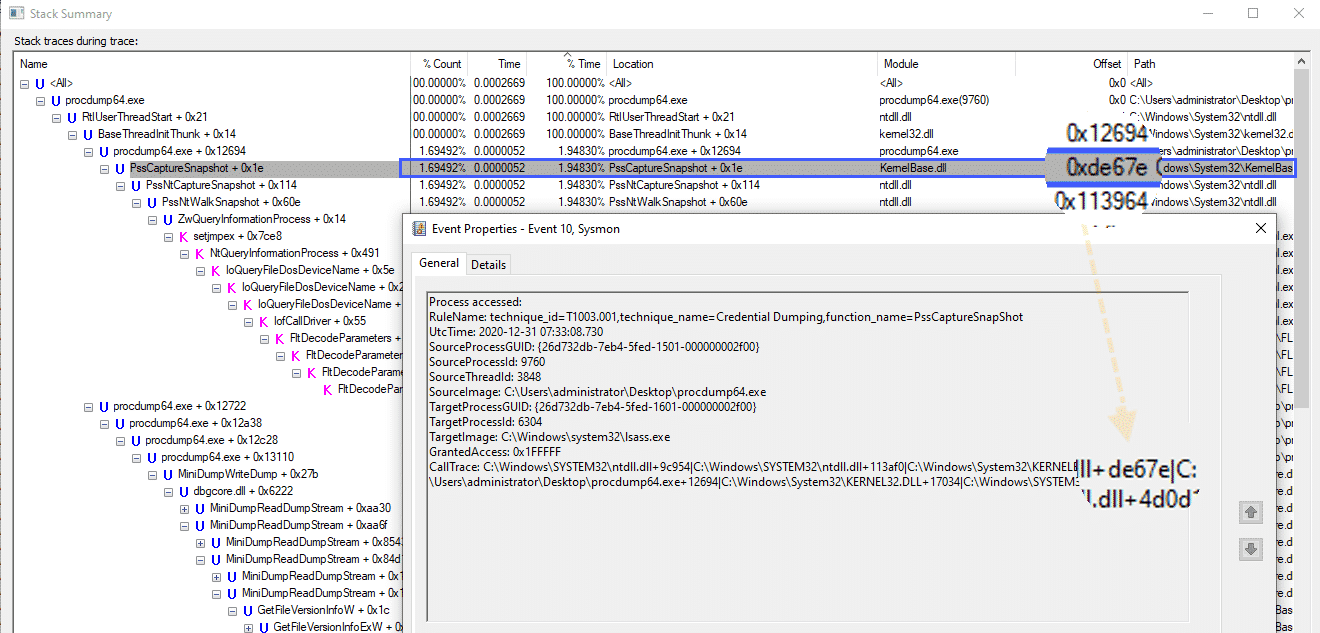
In the screenshot above we can see the PssCaptureSnapshot function address in both the Process Monitor window as well as the Sysmon ProcessAccess CallTrace field.
Those who are more proficient in reverse engineering may have more comprehensive and automated ways of translating these function calls. For a reversing newbie like myself however, the methods above worked as – at the very least – a proof of concept.
At this point, we now know what the Sysmon ProcessAccess CallTrace field is and we also know how to translate the function calls contained within this field.
We can now look at a few examples of how this data can be used within the Sysmon configuration file.
Before doing so however, it must be noted that the location of these function calls will most likely change depending on what Windows version is being used. For this post, Windows 10 20H2 Build 19042.685 was used.
Credential Dumping – MiniDumpWriteDump
A common technique for dumping credentials is using the MiniDumpWriteDump function
With the following Sysmon config snippet:
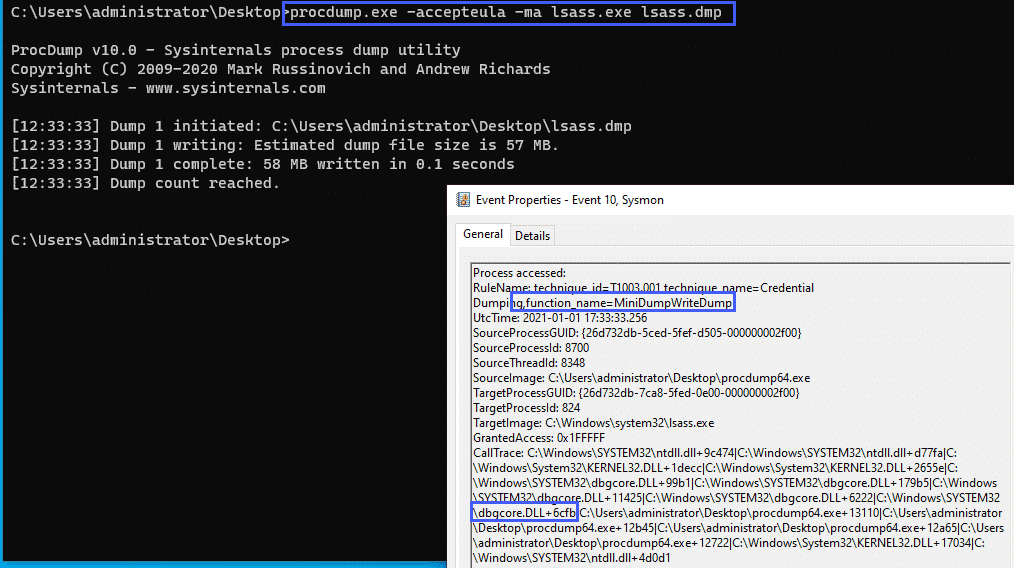
<CallTrace condition="contains" name="technique_id=T1003.001,technique_name=Credential Dumping,function_name=MiniDumpWriteDump">C:\Windows\SYSTEM32\dbgcore.DLL+6cfb</CallTrace>We can alert on this specific function call.
As a test, we can use procdump to dump the LSASS process:
Credential Dumping – PssCaptureSnapShot
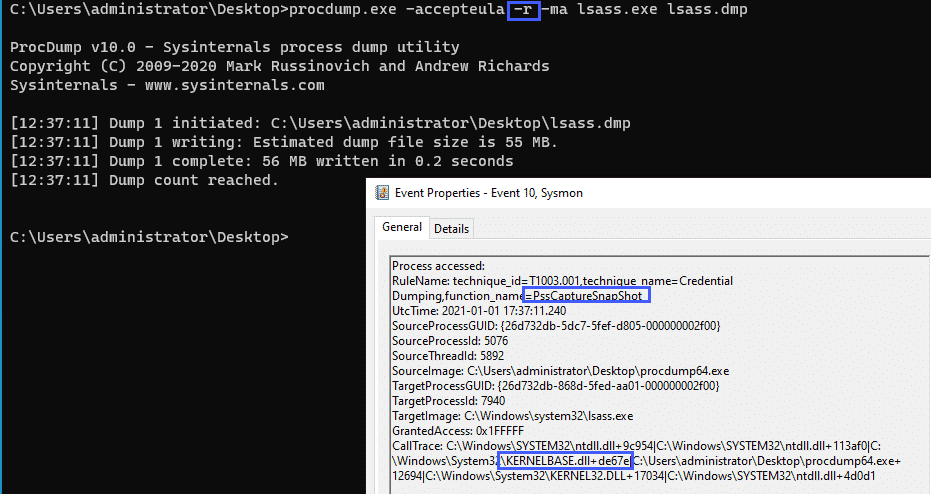
Taking a look at another example, we can run procdump with the -r flag which uses the PssCaptureSnapshot function rather than MiniDumpWrite.
We can use the following Sysmon config snippet to alert on this:
<CallTrace condition="contains" name="technique_id=T1003.001,technique_name=Credential Dumping,function_name=PssCaptureSnapShot">C:\Windows\System32\KernelBase.dll+de67e</CallTrace>And taking a look at the event generated:
The two above examples cover a few credential theft TTPs, which, as stated in the Sysinternals documentation, is one of the primary use cases for the Sysmon ProcessAccess event.
Using the data contained within the CallTrace field, we can extend the functionality of this event a little bit.
Let’s continue on with the examples and look at a few Office Macros TTPs.
We’ll be using the awesome "Generate Macro" test provided by Red Canary as a base for the following Macro tests: https://redcanary.com/blog/testing-initial-access-with-generate-macro-in-atomic-red-team/
WMI Execution
Given the following macro:
Sub Calc()
  Set objWMIService = GetObject("winmgmts:{impersonationLevel=impersonate}!\\.\root\cimv2")
  Set objStartup = objWMIService.Get("Win32_ProcessStartup")
  Set objConfig = objStartup.SpawnInstance_
  Set objProcess = GetObject("winmgmts:root\cimv2:Win32_Process")
  errReturn = objProcess.Create("calc", Null, objConfig, intProcessID)
End Sub
Combined with the following Sysmon config snippets:
<CallTrace condition="contains" name="technique_id=T1047,technique_name=Windows Management Instrumentation,function_name=ProviderExecMethod">C:\Windows\SYSTEM32\framedynos.dll+2b496</CallTrace>
<CallTrace condition="contains" name="technique_id=T1047,technique_name=Windows Management Instrumentation,function_name=CWbemProviderGlueExecMethodAsync">C:\Windows\SYSTEM32\framedynos.dll+2cb3e</CallTrace>
We can alert on the function calls used for WMI process execution:
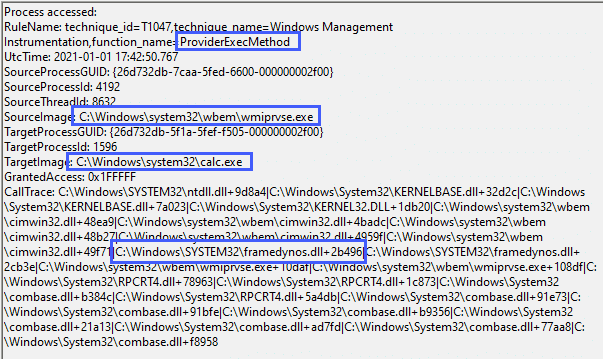
Note that in this case, the parent process for calc.exe is wmiprvse.exe and not WINWORD.exe as this particular macro breaks the typical ‘Word spawns a process’ lineage.
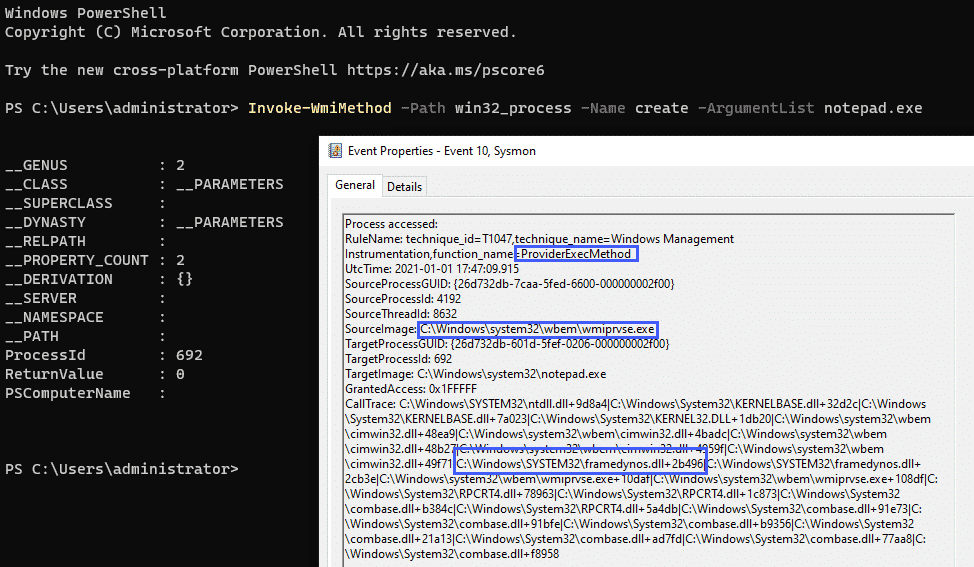
The Sysmon config above that alerts on the ProviderExecMethod function call will also fire if WMI is used to launch processes in other ways, such as PowerShell, and is not limited to macro executions:
Wscript.Shell
Let’s continue on with our examples and look at the WShellexec function which is another popular execution technique, looking at the following macro code:
Sub Auto_Open()
    Set WshShell = CreateObject("WScript.Shell")
    Set WshShellExec = WshShell.Exec("cmd.exe /c calc")
End Sub
We can alert on the WSShellExec function with the following config snippet:
<CallTrace condition="contains any" name="technique_id=T1059.005,technique_name=Command and Scripting Interpreter,function_name=WSHellExec">C:\Windows\System32\wshom.ocx+c8a0;C:\Windows\System32\wshom.ocx+c39d</CallTrace>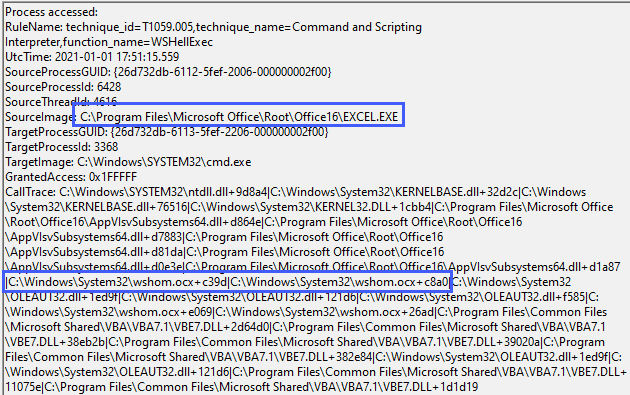
ShellExecute
Similar to Wscript.Shell, ShellExecute can also be used to launch processes via Office Macros, taking a look at the following macro code:
Function ShellExecuteVB()
    Dim objShell
    Set objShell = CreateObject("Shell.Application")
    Call objShell.ShellExecute("notepad.exe", "", "", "open", 1)
End Function
And the following config snippet:
<CallTrace condition="contains" name="technique_id=T1059.005,technique_name=Command and Scripting Interpreter,function_name=CSShellExecute_ExecuteAssoc">C:\Windows\System32\SHELL32.dll+9b5bd</CallTrace>
<CallTrace condition="contains" name="technique_id=T1059.005,technique_name=Command and Scripting Interpreter,function_name=CSShellExecute_DoExecute">C:\Windows\System32\SHELL32.dll+ae3b9</CallTrace>
Gives us the following results:
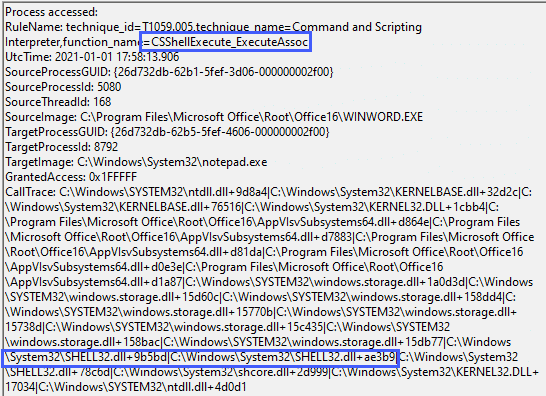
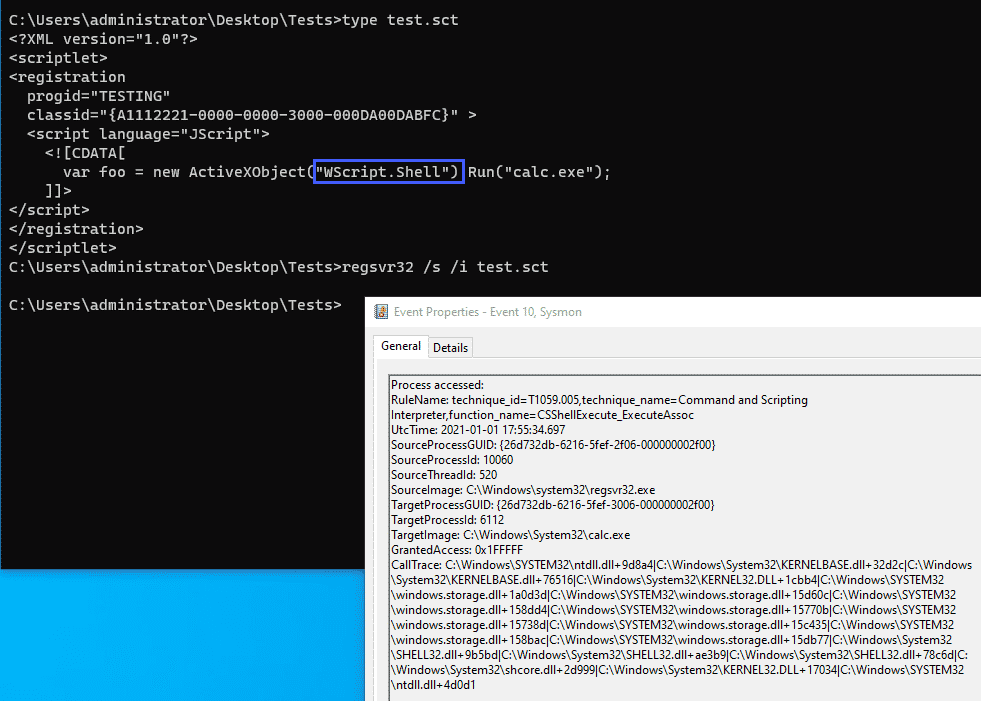
As with some of our previous examples, this function call is not unique to Office macros and will fire whenever the particular function is called, the screenshot below illustrates the same event firing for a sct scriplet executed via regsvr32:
Special shout out here to @spottheplanet and ired.team which were used as a reference for some of the techniques discussed here.
OpenProcess – Office Application
Looking at the final example, we can use our methodology of looking at function calls and combine that with Sysmon Rule Groups, the below example looks at an Office product calling the CreateProcessW function which in my example was used to alert on a VBA RunPE macro:
<Rule groupRelation="and" name="technique_id=T1059.005,technique_name=Command and Scripting Interpreter,function_name=CreateProcessW">
    <SourceImage condition="contains">C:\Program Files\Microsoft Office\Root\Office16</SourceImage>
    <CallTrace condition="contains">C:\Windows\System32\KERNELBASE.dll+76516</CallTrace>
</Rule>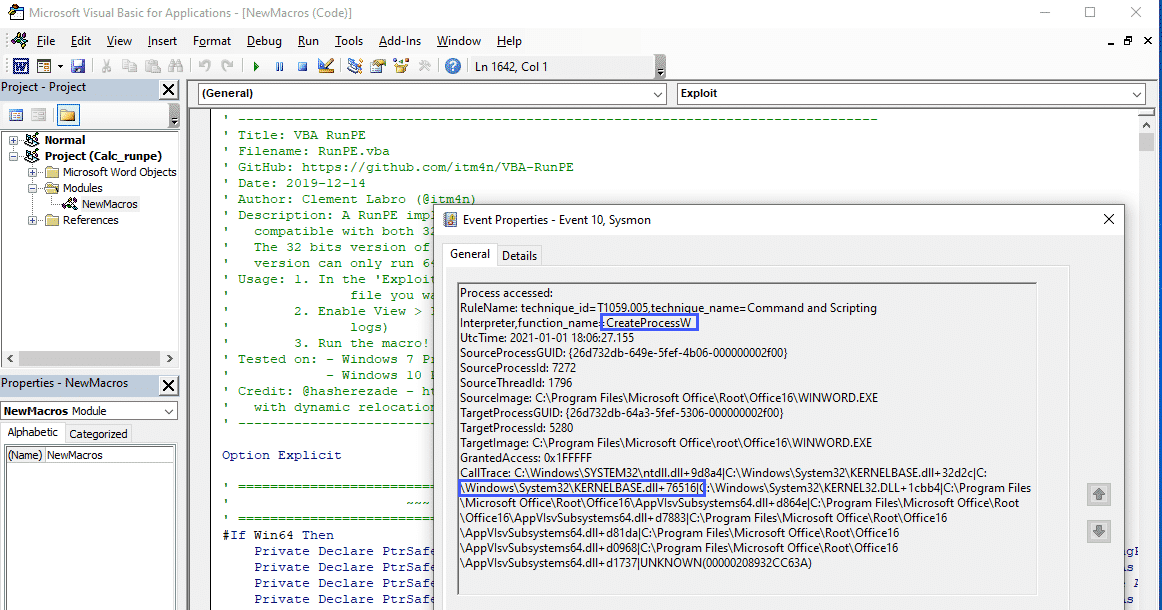
Putting it Together
The config snippets outlined above followed the naming convention used by Olaf Hartong’s Sysmon Modular project with an added field called function_name
| eval RuleNameSplit = split(RuleName,",")
| eval technique_name=mvindex(RuleNameSplit,2)
| eval function_name=split(technique_name,"=")
| eval function_name_only=mvindex(function_name,1)
And if we combine this with a simple stats
index=sysmon
| eval RuleNameSplit = split(RuleName,",")
| eval technique_name=mvindex(RuleNameSplit,2)
| eval function_name=split(technique_name,"=")
| eval function_name_only=mvindex(function_name,1)
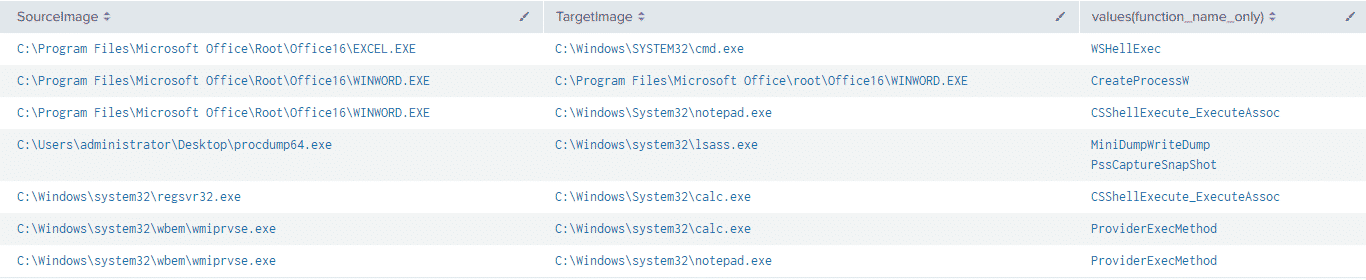
| stats values(function_name_only) BY SourceImage,TargetImageWe can get a nice view of the functions called by the tests we went through above:
Conclusion
The aim of this post was to highlight how the data contained within the Sysmon ProcessAccess CallTrace field can be translated and used to aid detection and hunting efforts.
The efficacy of this technique is somewhat blunted by the fact that the addresses of the function calls will change with Windows OS and software updates, combined with the manual process involved in translating the addresses into function names. However, despite these barriers, the use of translated function calls in the CallTrace field may be able to help with Sysmon configuration file tuning, especially when used in Sysmon RuleGroups. In addition, extracting additional context from data already being generated is also an added benefit.
Additional utility can also be extracted from these events when paired with other Sysmon telemetry such as ImageLoads and ProcessCreate events.
Appendix – Sample Sysmon Config Used for Post
For the purposes of this post, a bare-bones configuration file was used. If you want to tinker around with these events, feel free to test the following configuration. However, please consider this configuration as untested in a production environment:
<Sysmon schemaversion="4.40">
  <HashAlgorithms>*</HashAlgorithms>
  <CheckRevocation/>
  <EventFiltering>
    <RuleGroup name="" groupRelation="or">
      <CreateRemoteThread onmatch="include"></CreateRemoteThread>
    </RuleGroup>
    <RuleGroup name="" groupRelation="or">
      <ImageLoad onmatch="include"></ImageLoad>
    </RuleGroup>
    <RuleGroup name="" groupRelation="or">
      <ProcessCreate onmatch="include"></ProcessCreate>
    </RuleGroup>
    <RuleGroup name="" groupRelation="or">
      <FileCreateTime onmatch="include"></FileCreateTime>
    </RuleGroup>
    <RuleGroup name="" groupRelation="or">
      <NetworkConnect onmatch="include"></NetworkConnect>
    </RuleGroup>
    <RuleGroup name="" groupRelation="or">
      <ProcessTerminate onmatch="include"></ProcessTerminate>
    </RuleGroup>
    <RuleGroup name="" groupRelation="or">
      <DriverLoad onmatch="include"></DriverLoad>
    </RuleGroup>
    <RuleGroup name="" groupRelation="or">
      <RawAccessRead onmatch="include"></RawAccessRead>
    </RuleGroup>
    <RuleGroup name="" groupRelation="or">
      <ProcessAccess onmatch="include">
        <CallTrace condition="contains" name="technique_id=T1047,technique_name=Windows Management Instrumentation,function_name=ProviderExecMethod">C:\Windows\SYSTEM32\framedynos.dll+2b496</CallTrace>
        <CallTrace condition="contains" name="technique_id=T1047,technique_name=Windows Management Instrumentation,function_name=CWbemProviderGlueExecMethodAsync">C:\Windows\SYSTEM32\framedynos.dll+2cb3e</CallTrace>
        <CallTrace condition="contains any" name="technique_id=T1059.005,technique_name=Command and Scripting Interpreter,function_name=WSHellExec">C:\Windows\System32\wshom.ocx+c8a0;C:\Windows\System32\wshom.ocx+c39d</CallTrace>
        <CallTrace condition="contains" name="technique_id=T1059.005,technique_name=Command and Scripting Interpreter,function_name=CSShellExecute_ExecuteAssoc">C:\Windows\System32\SHELL32.dll+9b5bd</CallTrace>
        <CallTrace condition="contains" name="technique_id=T1059.005,technique_name=Command and Scripting Interpreter,function_name=CSShellExecute_DoExecute">C:\Windows\System32\SHELL32.dll+ae3b9</CallTrace>
        <Rule groupRelation="and" name="technique_id=T1059.005,technique_name=Command and Scripting Interpreter,function_name=CreateProcessW">
            <SourceImage condition="contains">C:\Program Files\Microsoft Office\Root\Office16</SourceImage>
            <CallTrace condition="contains">C:\Windows\System32\KERNELBASE.dll+76516</CallTrace>
        </Rule>
        <CallTrace condition="contains" name="technique_id=T1003.001,technique_name=Credential Dumping,function_name=MiniDumpWriteDump">C:\Windows\SYSTEM32\dbgcore.DLL+6cfb</CallTrace>
        <CallTrace condition="contains" name="technique_id=T1003.001,technique_name=Credential Dumping,function_name=PssCaptureSnapShot">C:\Windows\System32\KernelBase.dll+de67e</CallTrace>
      </ProcessAccess>
    </RuleGroup>
    <RuleGroup name="" groupRelation="or">
      <FileCreate onmatch="include"></FileCreate>
    </RuleGroup>
    <RuleGroup name="" groupRelation="or">
      <RegistryEvent onmatch="include"></RegistryEvent>
    </RuleGroup>
    <RuleGroup name="" groupRelation="or">
      <FileCreateStreamHash onmatch="include"></FileCreateStreamHash>
    </RuleGroup>
  <RuleGroup name="" groupRelation="or">
    <PipeEvent onmatch="include"></PipeEvent>
  </RuleGroup>
  <RuleGroup name="" groupRelation="or">
    <WmiEvent onmatch="include"></WmiEvent>
  </RuleGroup>
  <RuleGroup name="" groupRelation="or">
    <DnsQuery onmatch="include"></DnsQuery>
  </RuleGroup>
  <RuleGroup name="" groupRelation="or">
    <FileDelete onmatch="include"></FileDelete>
  </RuleGroup>
  </EventFiltering>
</Sysmon>
References & Thanks
- https://github.com/jsecurity101/Windows-API-To-Sysmon-Events
- https://github.com/trustedsec/SysmonCommunityGuide
- https://docs.microsoft.com/en-us/sysinternals/downloads/sysmon
- https://zeronights.ru/wp-content/themes/zeronights-2019/public/materials/3_ZN2019__andrej_skablonskijThreatHuntingInCalltrace.pdf
- https://www.ultimatewindowssecurity.com/securitylog/encyclopedia/event.aspx?eventid=90010
- https://docs.microsoft.com/en-us/sysinternals/downloads/procmon
- https://docs.microsoft.com/en-us/windows/win32/api/minidumpapiset/nf-minidumpapiset-minidumpwritedump
- https://redcanary.com/blog/testing-initial-access-with-generate-macro-in-atomic-red-team/
- https://www.ired.team/offensive-security/code-execution/t1117-regsvr32-aka-squiblydoo
- https://github.com/itm4n/VBA-RunPE
- https://github.com/olafhartong/sysmon-modular
Special thank you to https://twitter.com/TheHack3r4chan & https://twitter.com/malwaresoup from the ThreatHunting Slack for lending their time and expertise to help me talk through the ideas and concepts discussed in this post.
Anton is a BSides Toronto speaker, C3X volunteer, and an OSCE, OSCP, CISSP, CSSP certificate holder. Anton enjoys the defensive aspects of cybersecurity and loves logs and queries.