Intro
Defending an Active Directory environment, particularly a large one, is a daunting task. Telemetry generated by Active Directory itself as well as the hosts connected to it are critical components when building out detection logic. In order to provide comprehensive detection coverage, telemetry from both the network and host layers is required. With this in mind, the aim of this post is to examine some Active Directory attacks, including enumeration and exploitation, at the network layer.
Our Tooling
I tell whoever will listen about Moloch, an amazing tool to have in a defender’s toolbelt. Moloch has certain limitations, however, particularly when parsing out certain protocols, especially RPC and LDAP. Zeek parses these protocols, however, it does not have as powerful a user interface as Moloch.
Luckily for us, a project called Malcolm uses the interface from Moloch, combined with the parsing power of Zeek, presenting the logs in an easy to query interface. Malcolm, like Moloch, is an incredibly powerful visibility and analysis tool for network traffic – I am only scratching the surface of its capability here, so I highly encourage you to check it out for yourself.
The Setup
For the purposes of this post, we will not be building a full-blown attack chain within an Active Directory environment but will rather look at some common tooling and techniques in order to get a sense of what these look like at the network layer, let’s start with Powerview.
PowerView
For the PowerView section, I’ll be referencing Will’s awesome PowerView tricks gist.
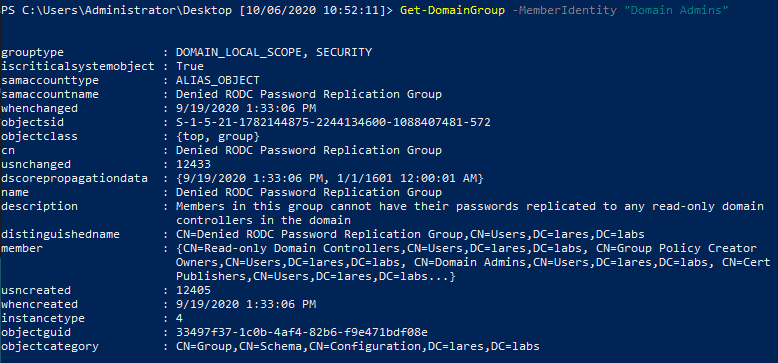
Get-DomainGroup
Let’s start with the Get-DomainGroup command, which grabs members of a group you specify, recursing upwards:
![]()
We run the command, looking at the Domain Admins group, and we can see the results returned to us:
 Now let’s take a look at what this looks like on the network layer, looking at the LDAP protocol specifically, we can do this in Malcolm with the protocols == ldap query:
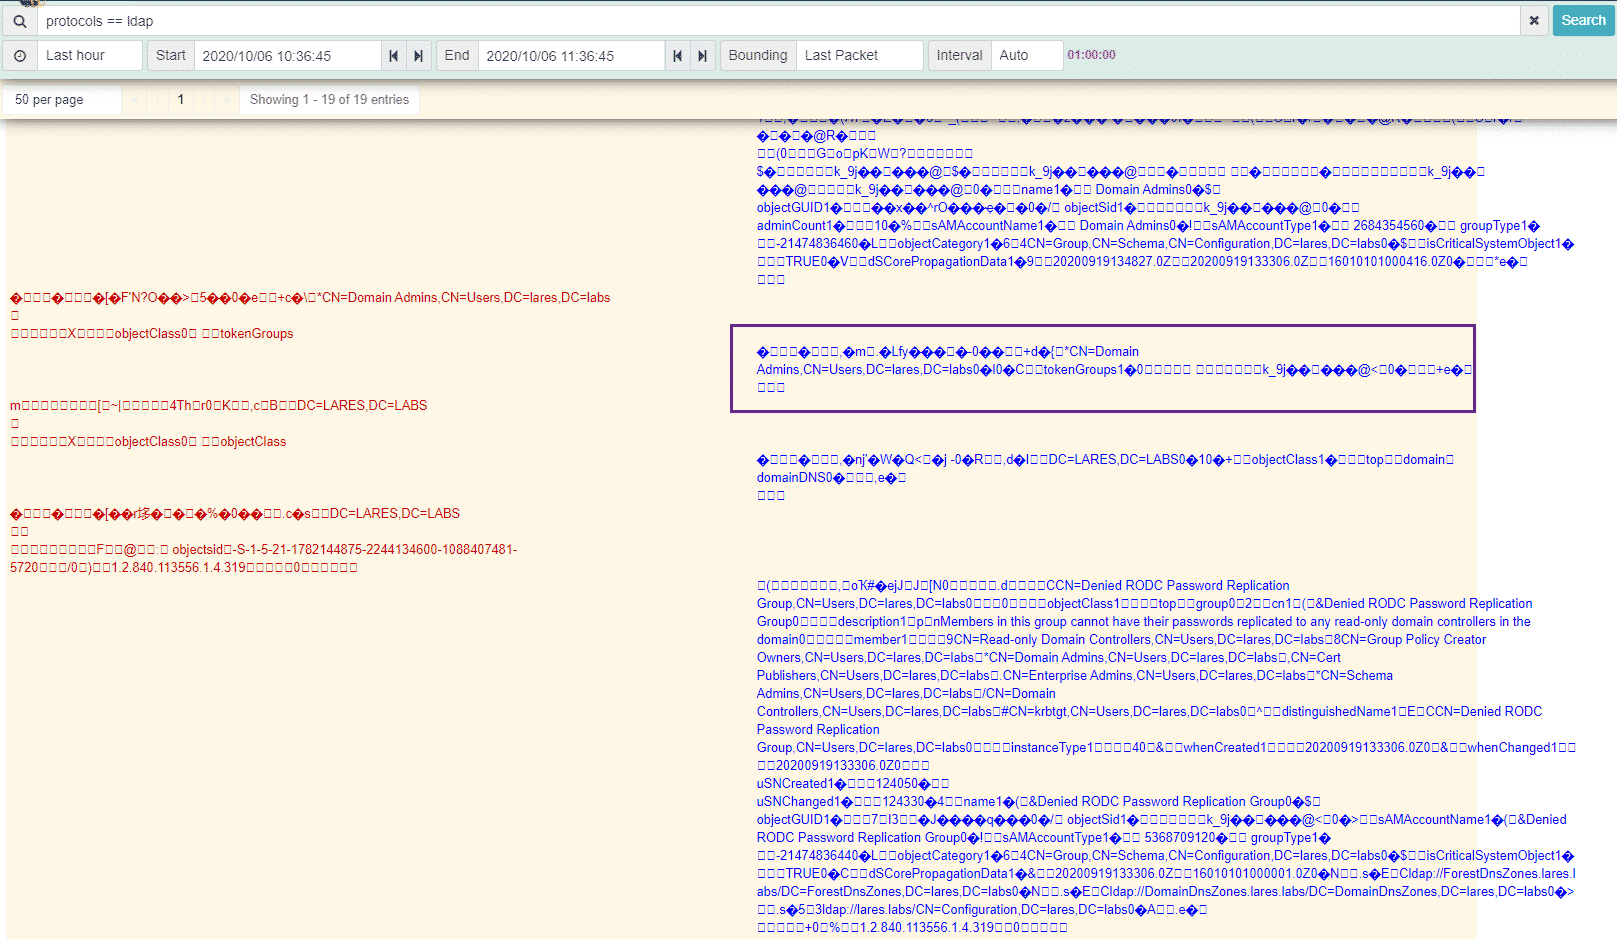 We can see the entire network ‘conversation’ happening, with the source traffic in red on the left and the destination traffic on the right in blue. We can see the LDAP query being sent over the wire as well as the results being returned from the Domain Controller.
Let’s look at another example.
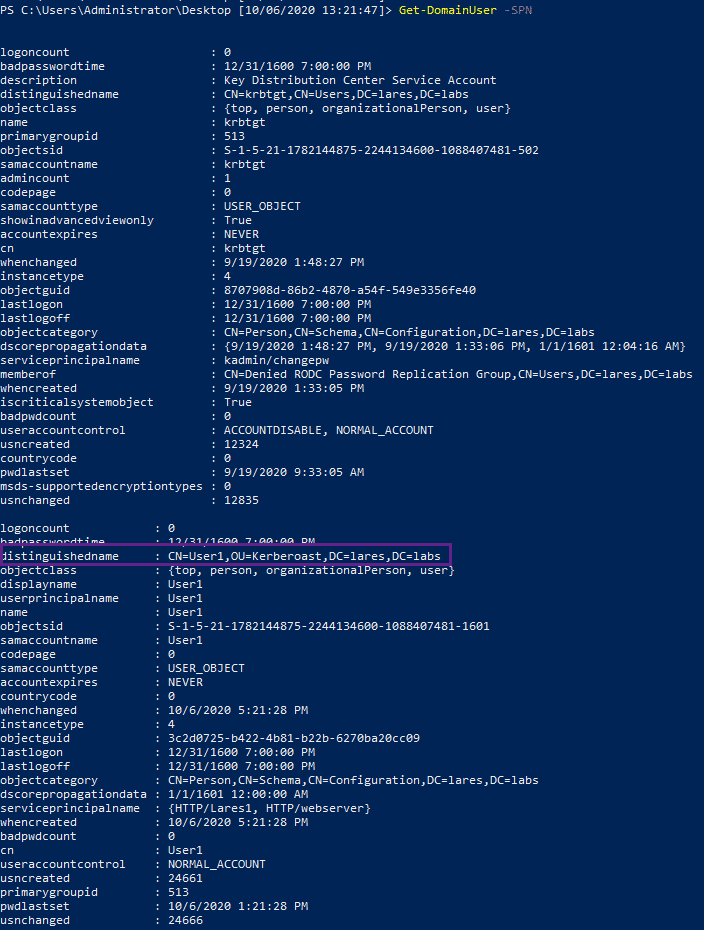
Get-DomainUser -SPN
The Get-DomainUser -SPN command is self-explanatory and pulls user accounts with Service Principal Names set. In my case, I have a user named User1 that has an SPN set, and we can see these results returned back to us:
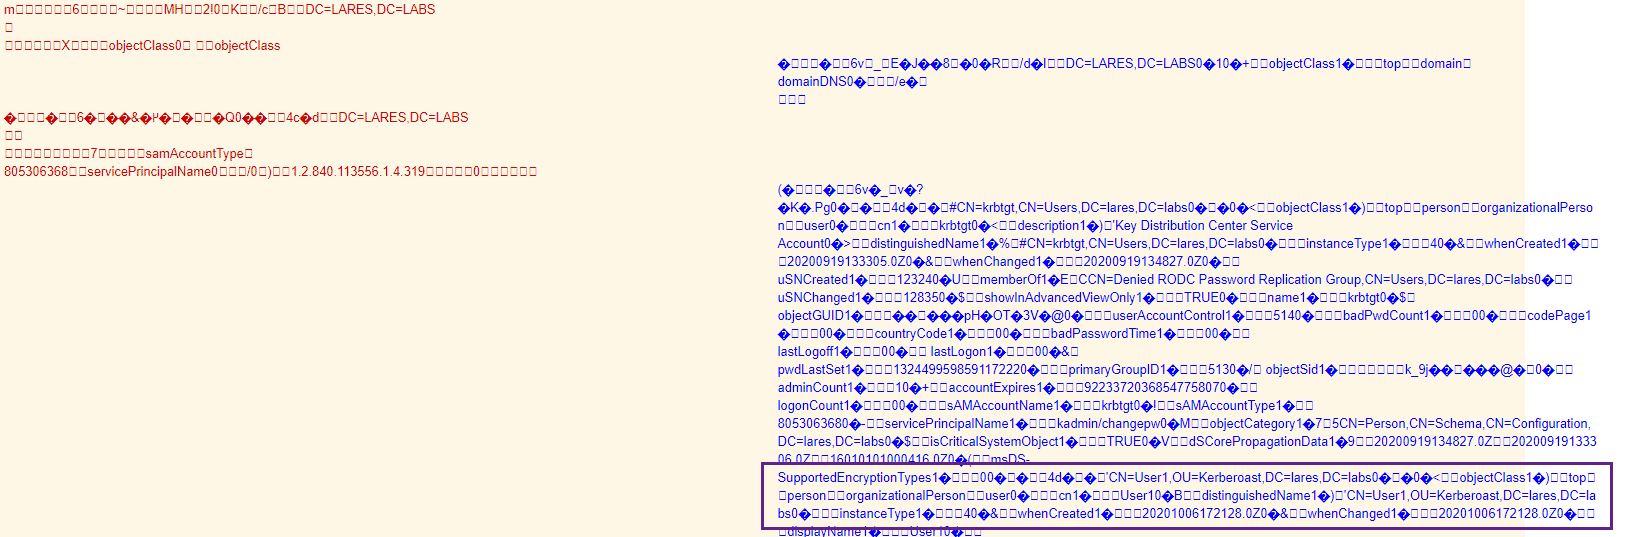
 Similar to the previous example, we can see the LDAP traffic being sent back and forth between our two hosts:
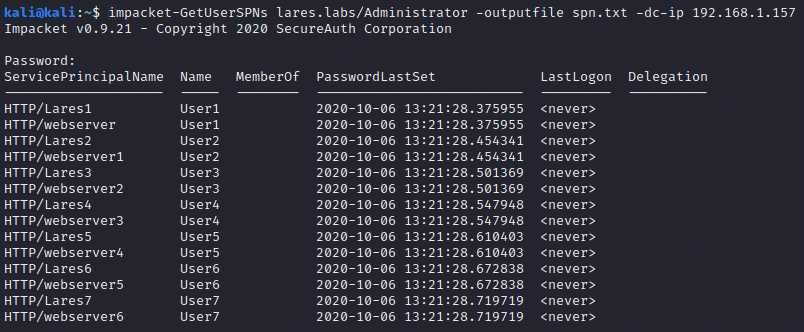
Impacket-GetUserSPNs
Let’s look at another example, using Impacket’s GetUserSPNs command. This time, the commands are running from a remote machine, outside the domain:
 We tell Malcolm to look at the source IP of our “attacking” machine as well as the Zeek log type of Kerberos: ip.src == 192.168.1.148 && zeek.logType == kerberos
We can then use the “Connections” option to visually represent this traffic:
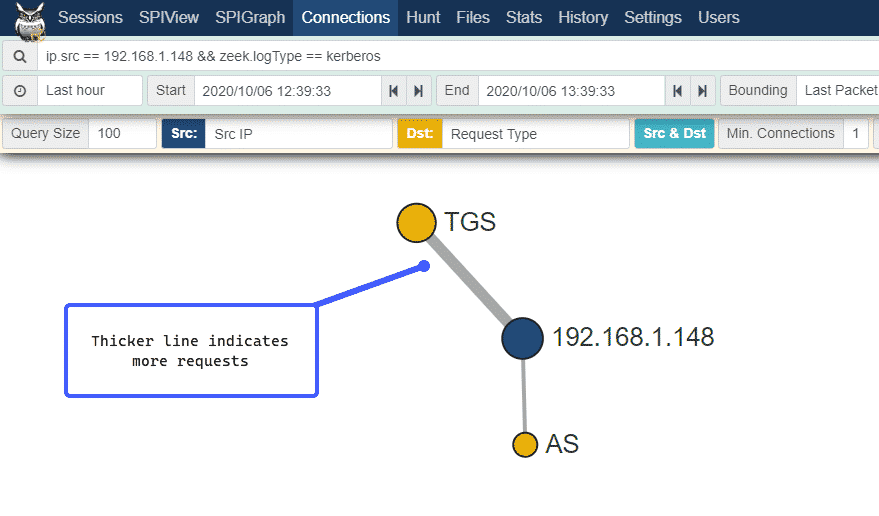
We can see above that the line representing Ticket-Granting Service (TGS) ticket requests is thicker than the Authentication Server (AS) request, this is because the IP address 192.168.1.1.148, which is our attacking machine, requested more than one TGS, but only one AS.
We can look at this Kerberoast attack in a different way by telling Malcolm to change the yellow Dst portion of the graphic to represent the Encryption Type field of our Kerberos requests, rather than Request Type:
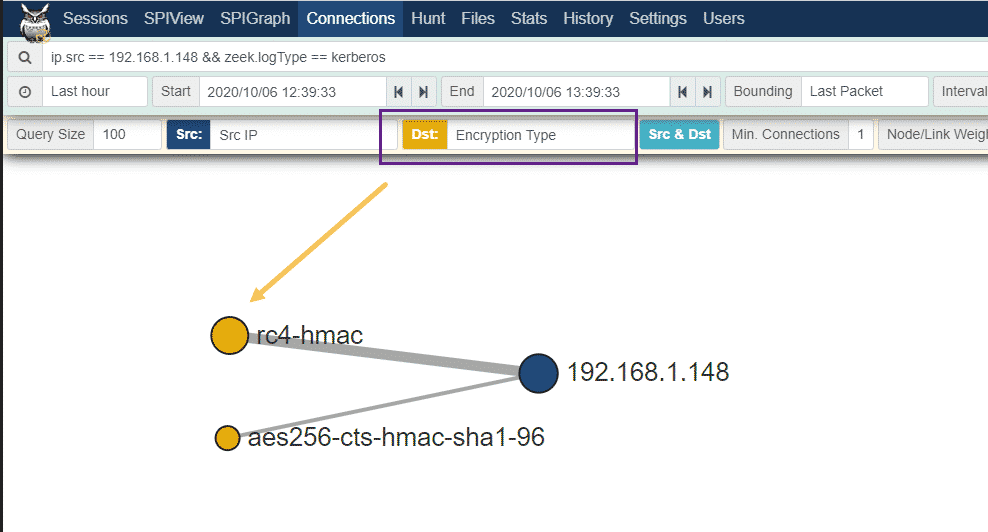 We see above that the line for rc4-hmac is thicker – this also confirms that a downgrade attack occurred, as the requested tickets were returned in RC4 rather than AES format. We can flex the power of the Moloch / Malcolm user interface by clicking on the Encryption Type field within the Moloch logs and choosing the “Export Unique Encryption Type with counts” option:
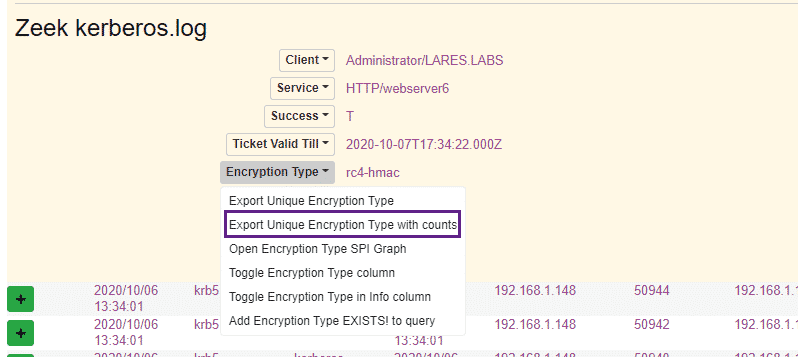 This gives us the following, which illustrates how many Kerberos tickets were requested per encryption type:
![]()
If we take a look at the MITRE ATT&CK page for Kerberoasting we can see the following description:
Adversaries possessing a valid Kerberos ticket-granting ticket (TGT) may request one or more Kerberos ticket-granting service (TGS) service tickets for any SPN from a domain controller (DC).
And the following defensive guidance:
Enable Audit Kerberos Service Ticket Operations to log Kerberos TGS service ticket requests. Particularly investigate irregular patterns of activity (ex: accounts making numerous requests, Event ID 4769, within a small time frame, especially if they also request RC4 encryption [Type 0x17])
In this example, we used the same detection logic of logging TGS requests with RC4 encryption, however, we did so on the network, rather than the host layer. It’s always nice to have options as well as robust detection coverage!
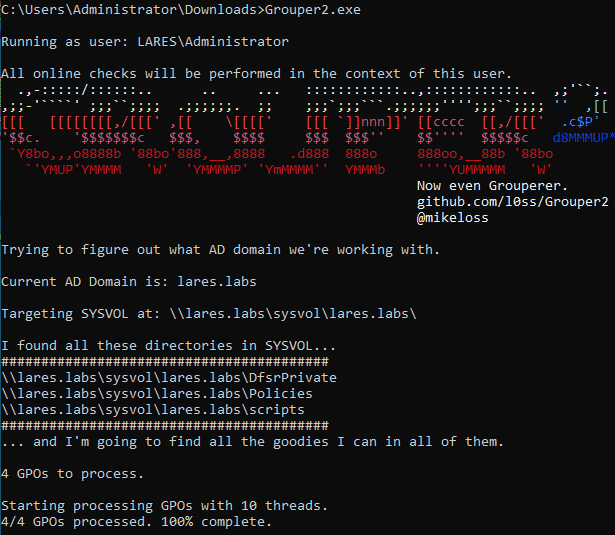
Grouper2
Grouper2 is a tool written by Mike Loss and is designed to find vulnerabilities and misconfigurations in Active Directory Group Policy.
Let’s run Grouper2:
And then use the following query in Malcom to look at the SMB traffic originating from the host on which Grouper2 was running, in my case 192.168.1.158:
ip.src == 192.168.1.158 && zeek.service == smb
If we take a look at the events, we can see our 192.168.1.158 host opening up and querying the various files that contain our domains’ Group Policy:
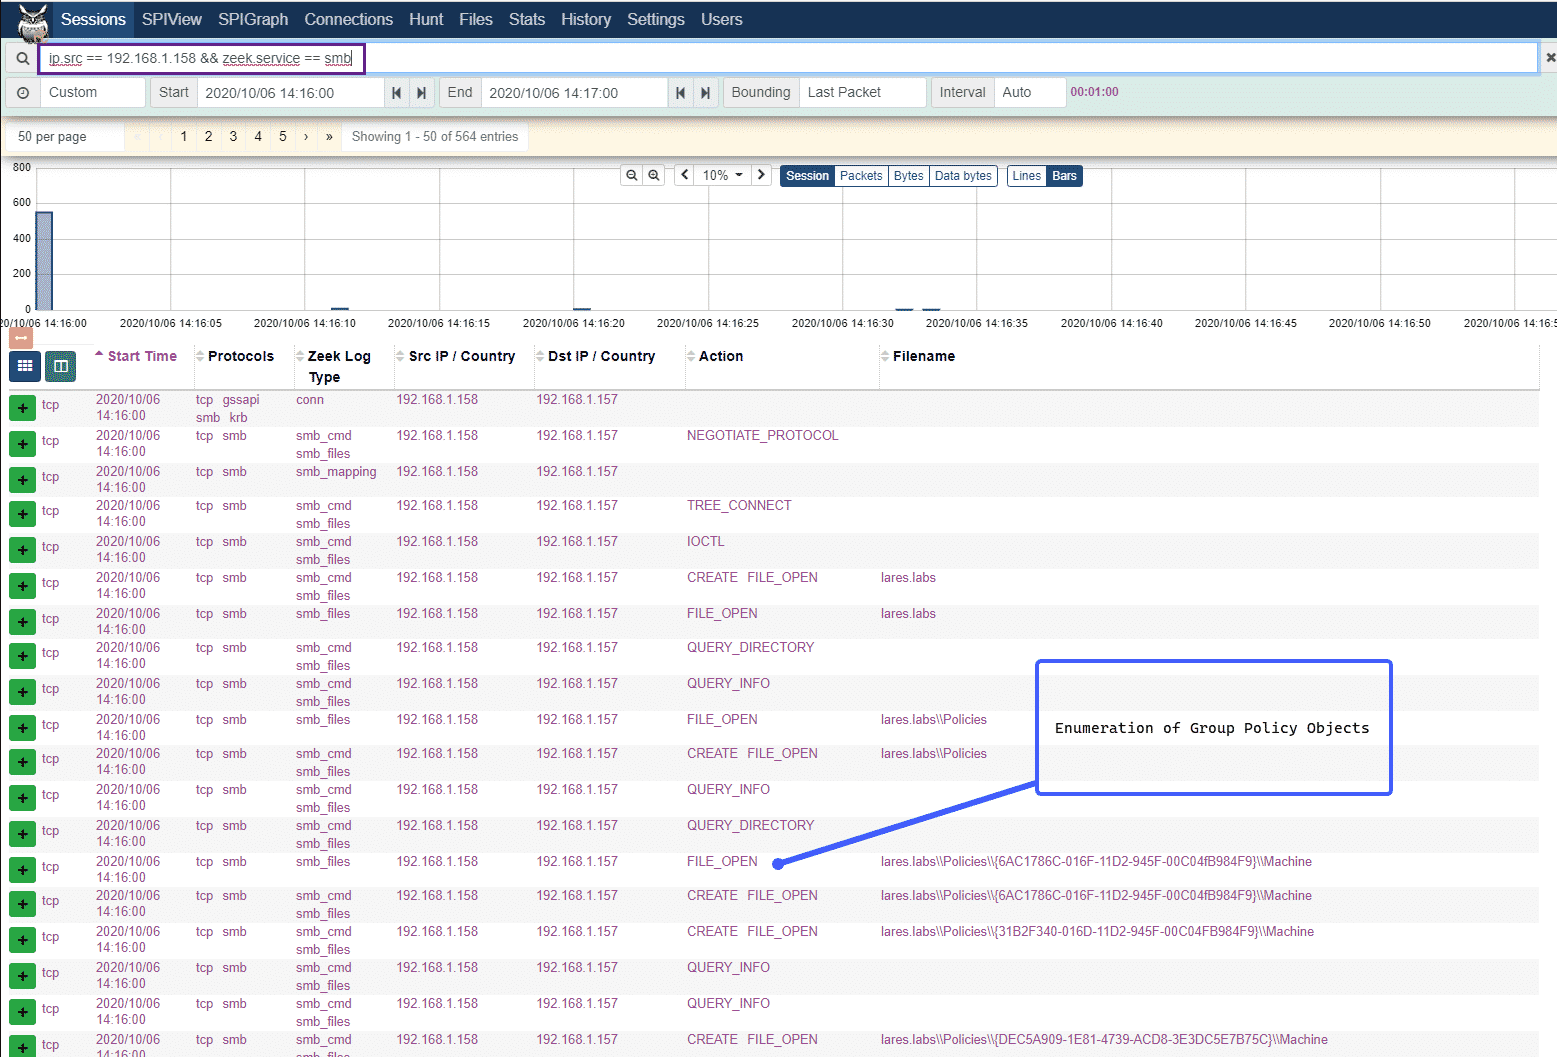 This type of activity would most likely occur in a normal Active Directory environment, however, this layer of visibility provides an opportunity to baseline behavior: “Should this computer be reading X group policy?” and also provides a rich set of data that can be used during an incident response.
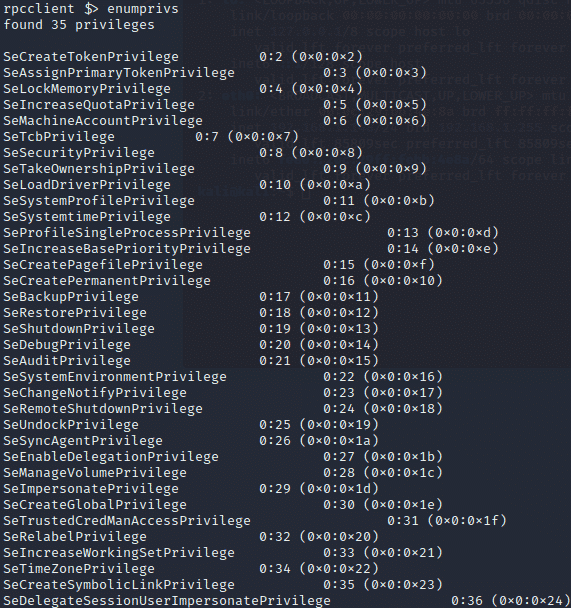
rpcclient
Now that we’ve looked at some LDAP, Kerberos, and SMB traffic, let’s take a look at what RPC enumeration looks like at the network layer. For this, I’ll be using rpcclient. After connecting to our domain, we run a simple enumprivs command to list the privileges that our account has:
Now let’s take a look at the network layer for this activity:
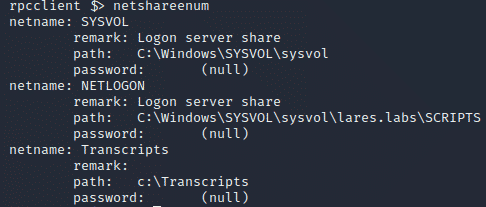
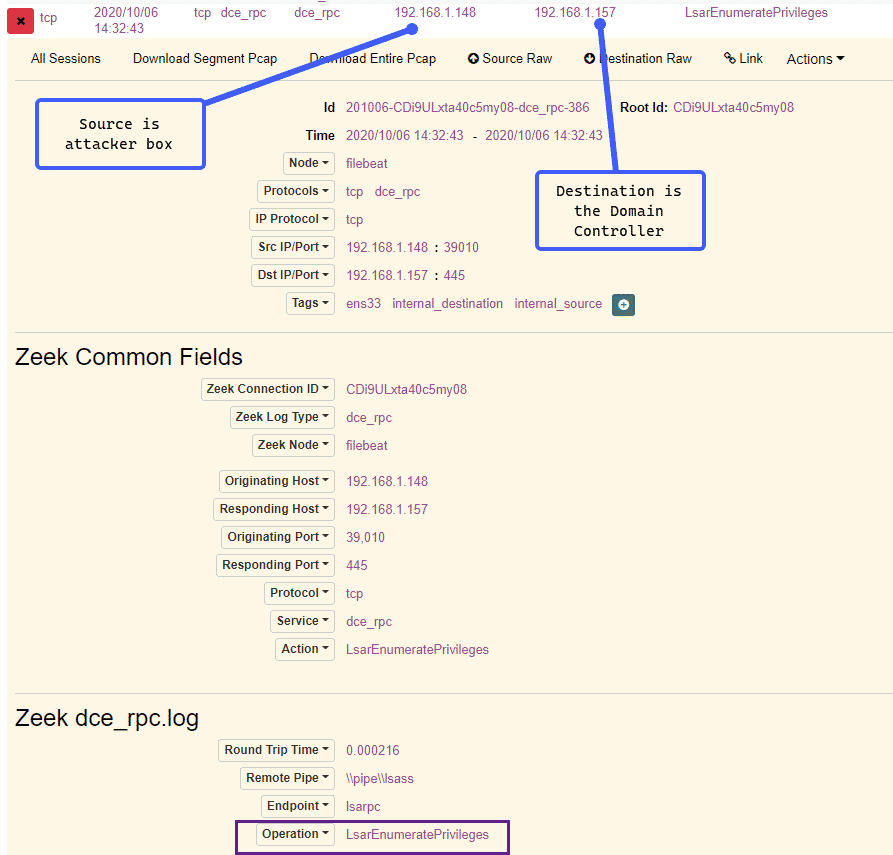 We can see from above that our source IP is our “attacker” machine and our destination IP is the Domain Controller. We can also see a call to the LsarEnumeratePrivileges RPC call, which corresponds to our enumprivs rpcclient command. Now let’s try a simple share enumeration, using the netshareenum command:
Once again let’s flip the network traffic to see what this looks like:
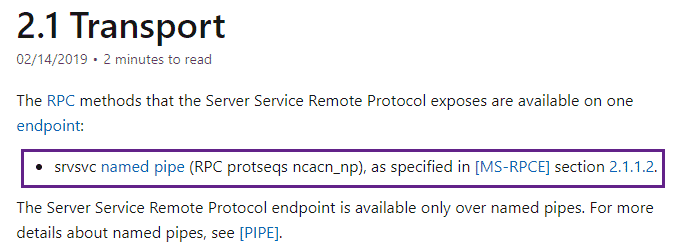
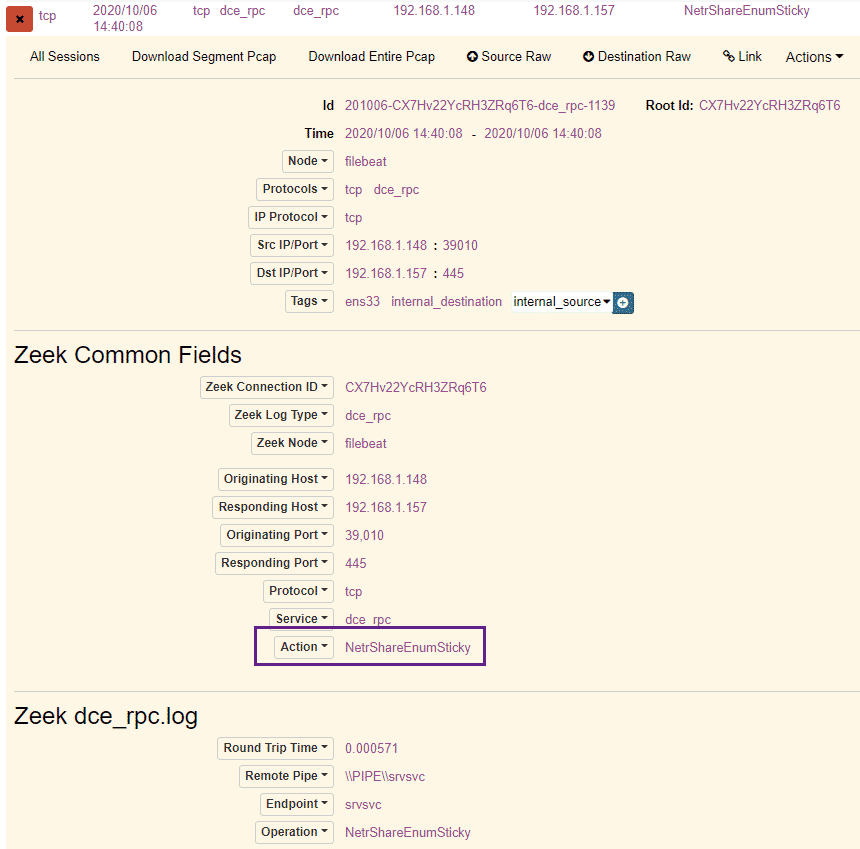 We can see above the call to the NetrShareEnumSticky RPC call, as well as a connection to the srvsvc pipe – we can, very gently, dip our toes into the Microsoft RPC documentation and here to get a better sense of what these do:
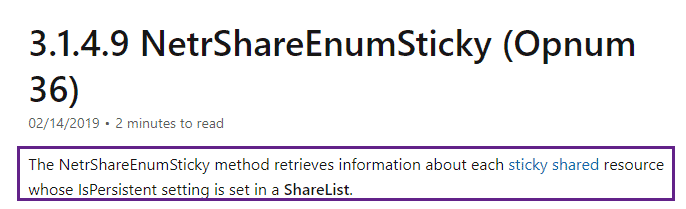
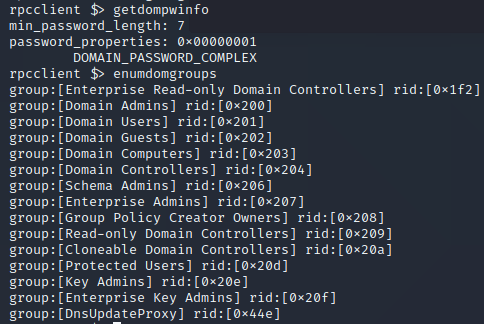
An interesting RPC call indeed and perhaps useful to baseline what hosts are enumerating network shares. Let’s execute two more rpcclient commands, getdompwinfo, and enumdomgroups to enumerate the groups on the domain as well as the domains password requirements:
Now let’s use the following query in Malcolm, where 192.168.1.148 is the IP from which rppclient was executed:
ip.src == 192.168.1.148 && protocols == dce_rpc
We can once again use Malcom’s / Moloch’s “Connections” view, changing the “Dst” to show the RPC Action to get a view of what RPC calls our “attacker” IP made:
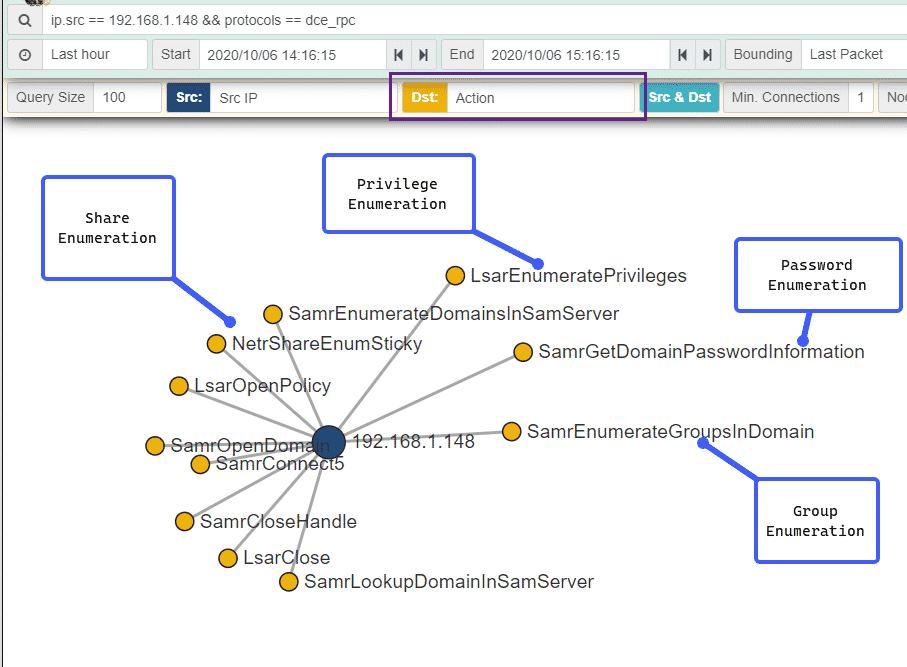 Here we can see the RPC calls used for share enumeration, privilege enumeration, password enumeration as well as group enumeration. Moloch and Malcolm’s powerful interface really shines here, presenting a flood of data in an easy and understandable chart.
Sharphound
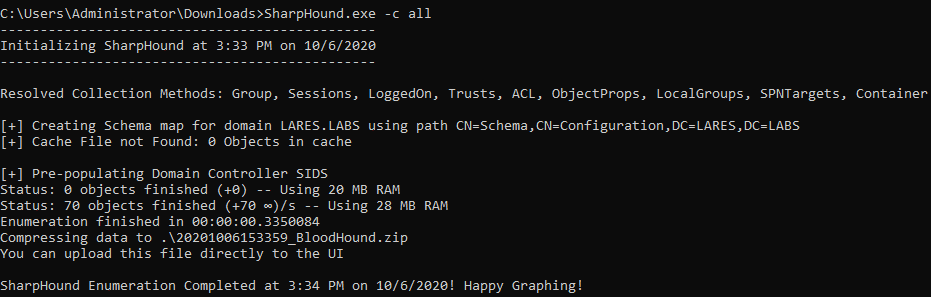
Sharphound is a tool used for Active Directory data enumeration and collection, which is subsequently fed into BloodHound. SharpHound comes with a ton of different options for data collection in an Active Directory environment. This section is not meant to be a “how to detect SharpHound” tutorial. However, let’s examine some of the network-level telemetry generated when SharpHound is executed. In our case we will execute it with a -c switch of ‘all’ and will let SharpHound run:
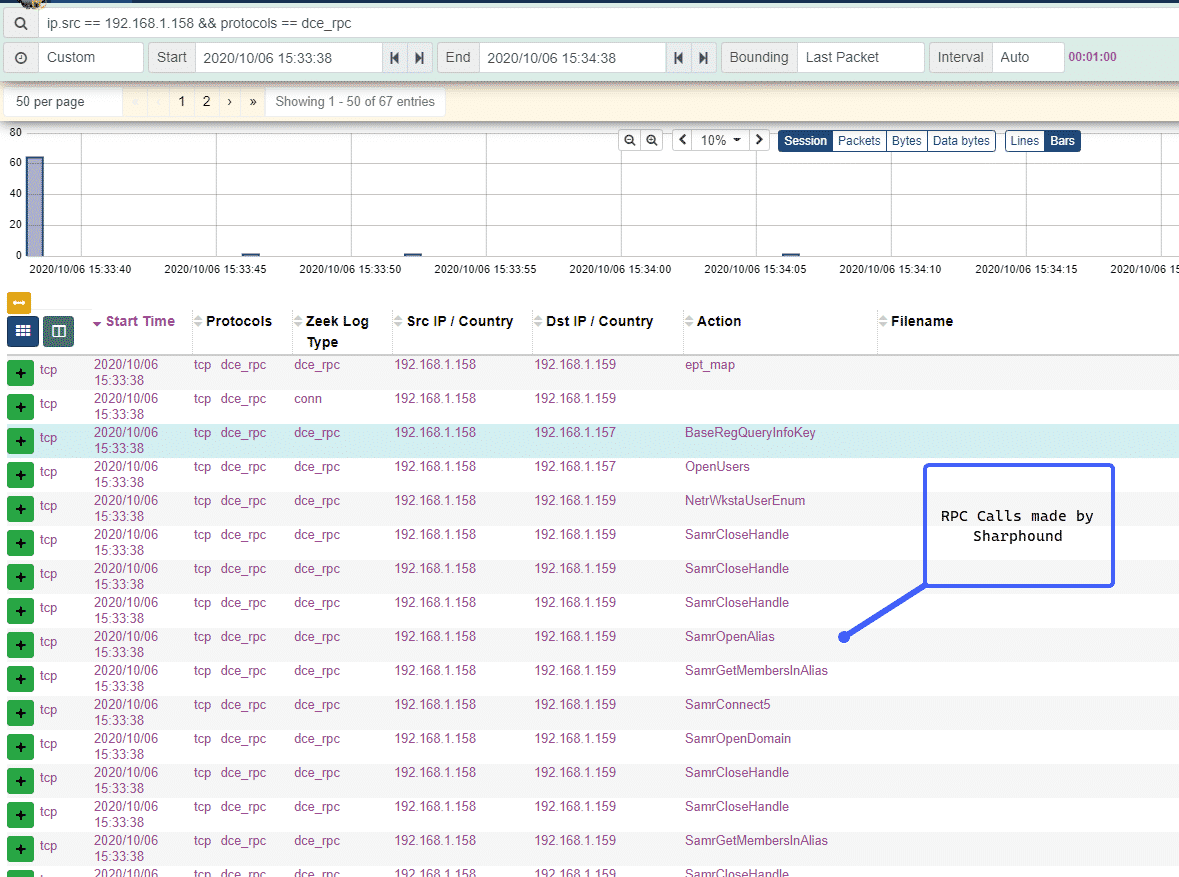
 Now that our SharpHound collection has finished, let’s take a look what network-level RPC calls were made:
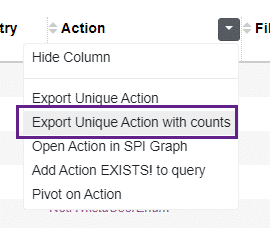
 We can then click on the “Action” column and export the RPC calls made into a list showing how many times each call occurred:
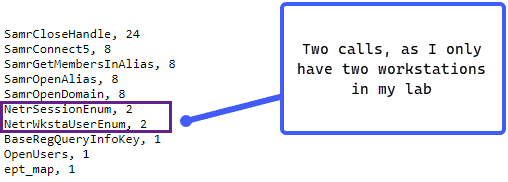
With our results presented this way, we can gain a deeper understanding of what occurred under the hood of our SharpHound execution. We can see two calls to NetrSessionEnum and NetrWsktaUserEnum – this makes sense as I only had two workstations in my little lab and we can see that SharpHound is enumerating the workstations on the domain as well as gathering session information for those workstations:
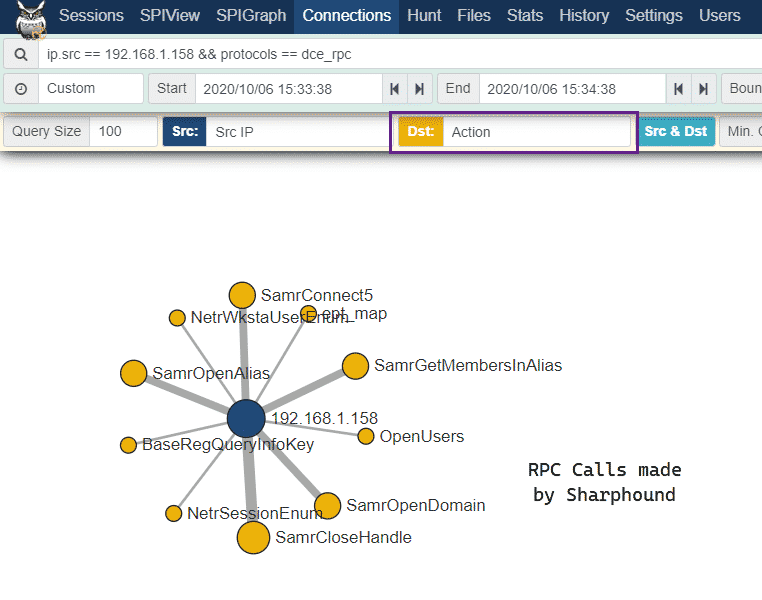
We can then use the Connections option in Moloch/Malcolm to get a birds-eye view of the RPC calls that were made by our SharpHound execution:
 Detection of enumeration activity is sometimes tricky, however, we at least have some data to work with at this point which we can baseline and compare to normal behavior in our Active Directory environments.
Mimikatz Masterkeys
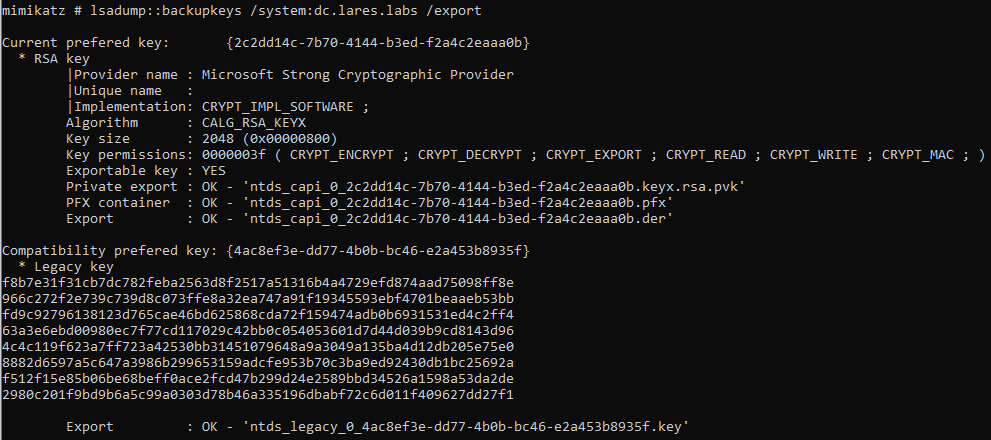
Let’s switch gears a bit and look at the lsadump::backupkeys command from Mimikatz. This module allows for the retrieval of the domain-wide backup DPAPI key. You can read more about this command on the AD Security blog and another perspective on the HarmJ0y blog. Let’s execute our command:
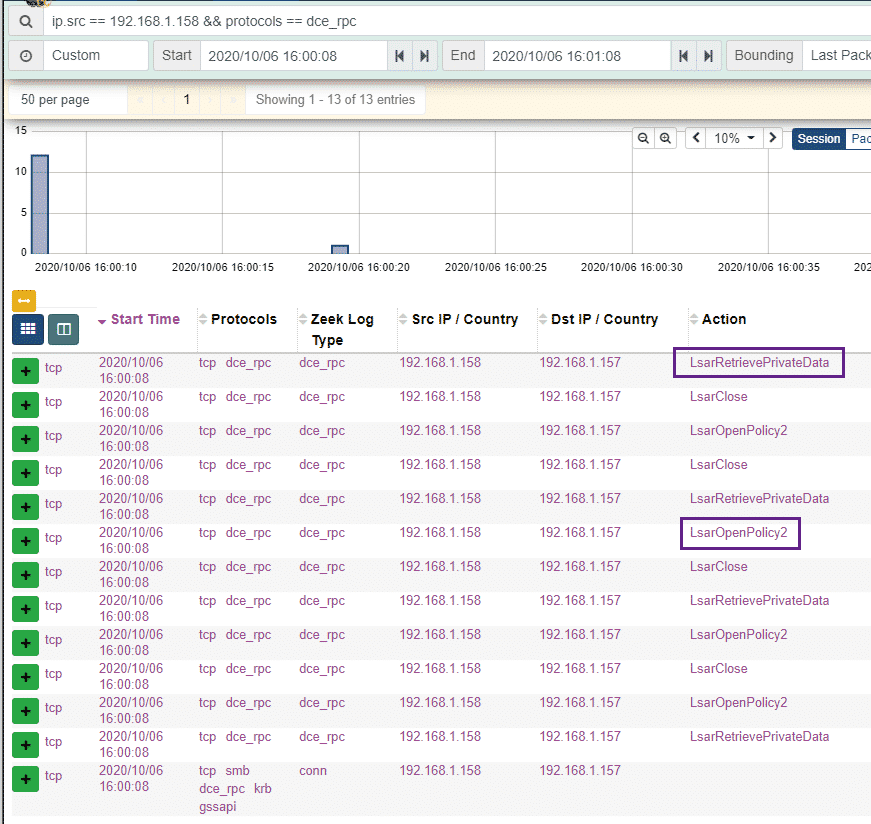
 And take a look at the network traffic generated:
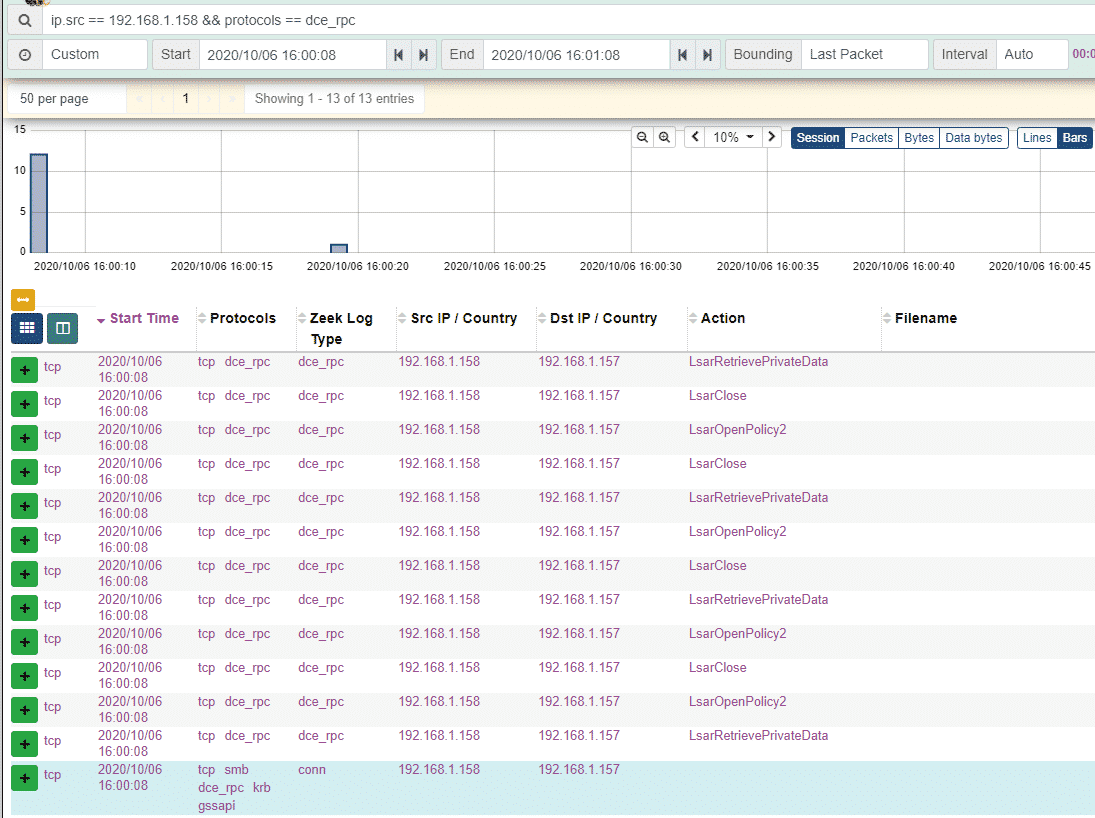 The events observed above make sense, this command is interacting with the Local Security Authority (LSA) and we see a bunch of RPC calls starting with the Lsar prefix – the LsarRetrievePrivateData and LsarOpenPolicy2 calls look interesting:
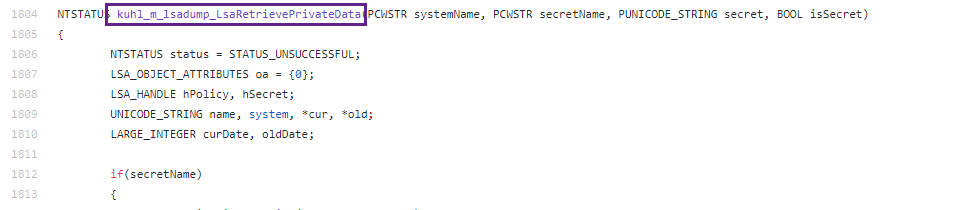
 We can go ahead and search for these in the Mimikatz source code. We can see the code that uses LsarRetrievePrivateData
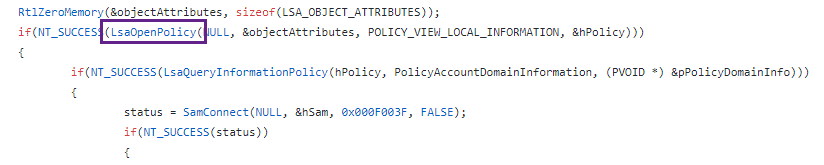
 And uses LsarOpenPolicy2 as well
 Once again this telemetry is not meant to “detect mimikatz” – but rather to provide valuable data for detection engineering and threat hunting efforts. Practitioners will find the data helpful for understanding what’s going on under the hood of the Active Directory environment and even potentially help in the troubleshooting of applications.
Mimikatz RPC
A perhaps lesser-known feature of Mimikatz is its ability to be controlled remotely through RPC. Didier Stevens provides a really great overview of this technique.
We start our RPC Server:
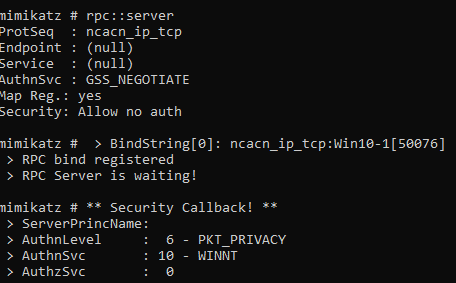
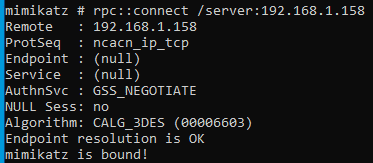
Using a client machine, we then connect to our listening RPC Server:
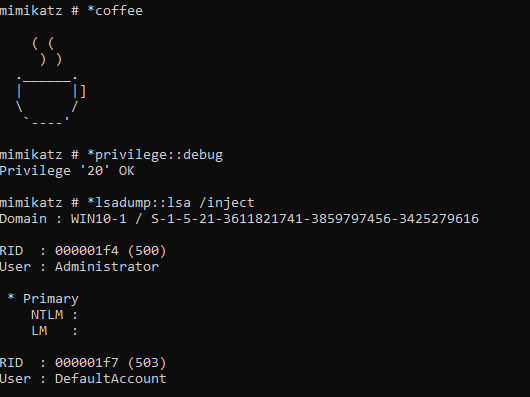
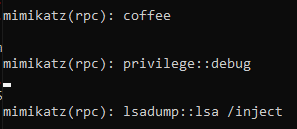
On the server end, we can issue various commands, in my case I followed Didier’s example and executed coffee privilege::debug and lsadump::lsa /inject.
On the client side, we can see these commands getting executed:
Once again, let’s take a look at the network traffic generated. This time we see a few RPC calls that Zeek was unable to parse which are labeled as “unknown” – in addition to this we can see the NTLM authentication occurring over RPC as well as a call to ept_map
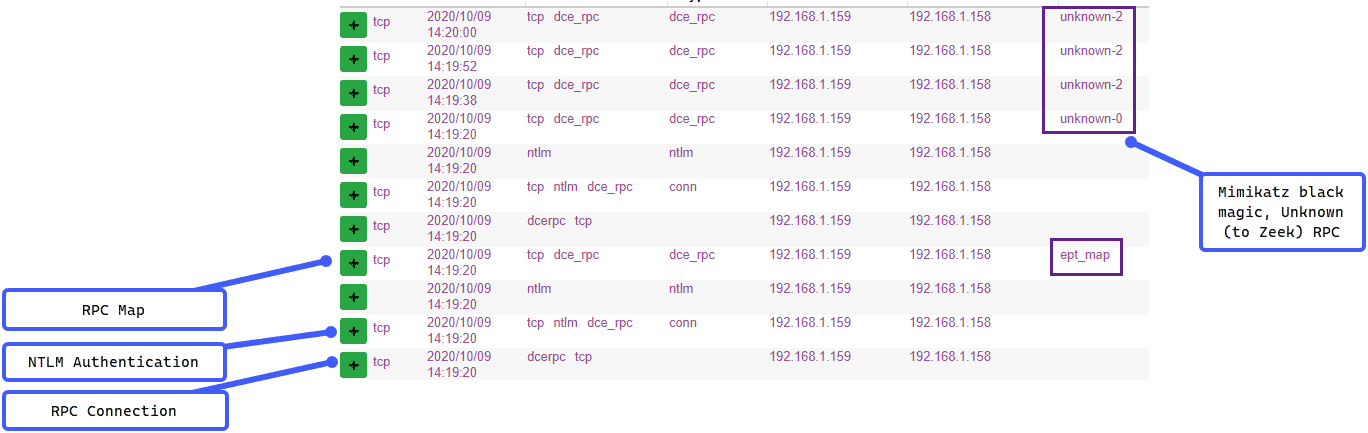
Let’s dig into the unknown RPC calls a bit, if we open up the session information in the Moloch/Malcolm interface, we can see a GUID/UUID value. A quick search through the Mimikatz source code reveals that this UUID is used in the mimicom.idl which is used by Mimikatz for the RPC server/client functionality.
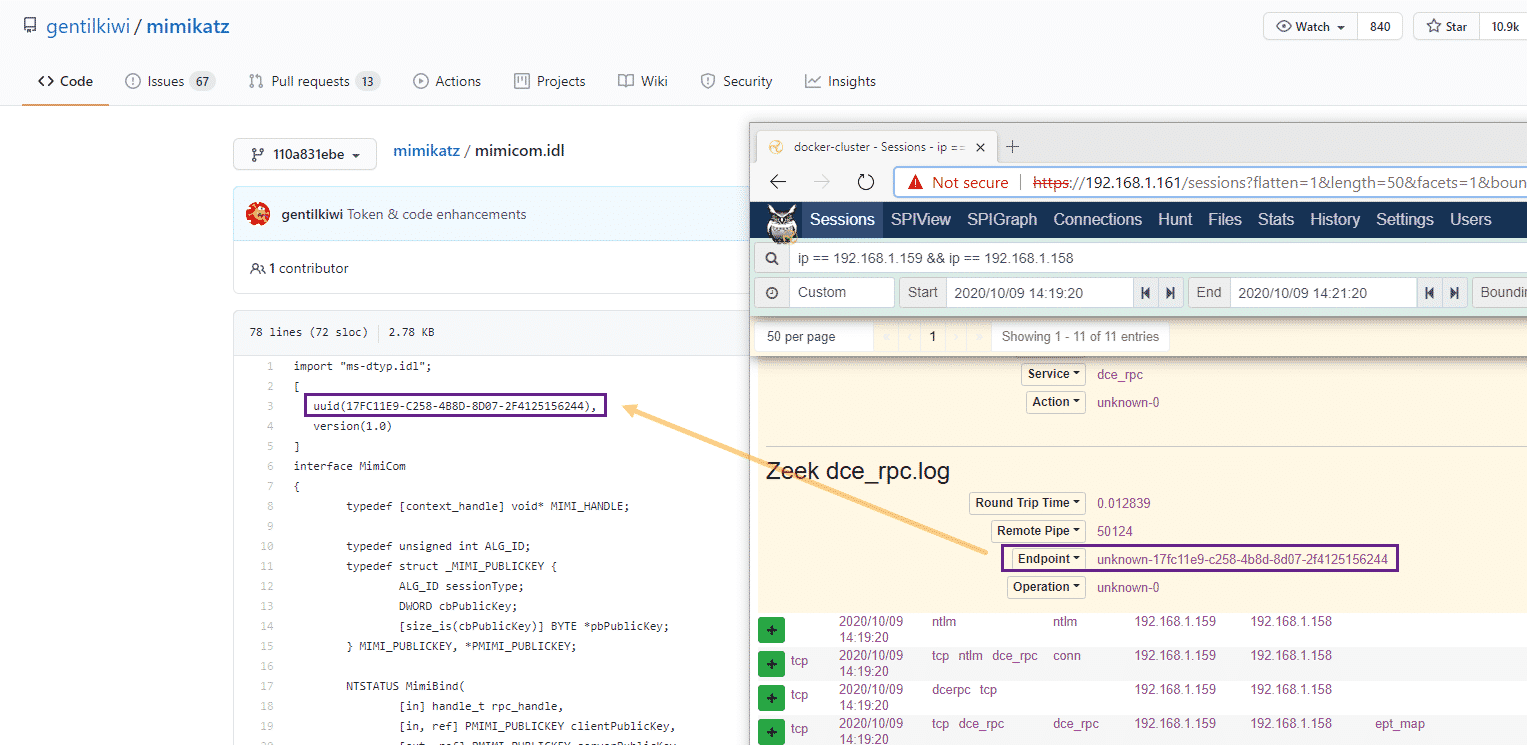
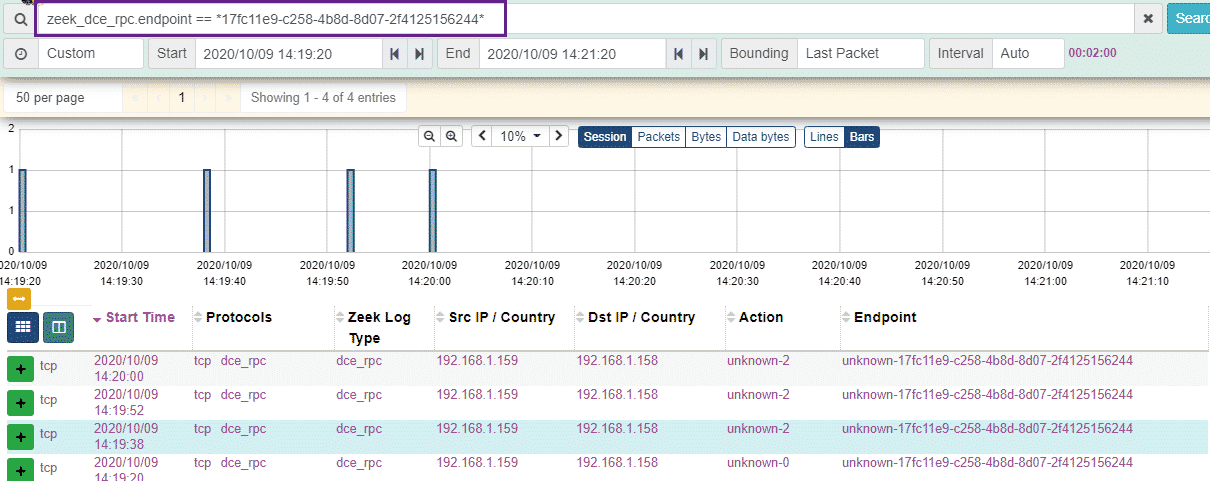
We can then use the powerful querying capability of Malcolm and search for this unique UUID: zeek_dce_rpc.endpoint == *17fc11e9-c258-4b8d-8d07-2f4125156244*
And our results are presented to us, with the only sessions containing this UUID being used for our Mimikatz RPC server/client testing, neat!
Conclusion
The aim of this post was to explore some telemetry that is generated at the network level when performing some common Active Directory attacks and enumeration. This type of visibility, when combined with comprehensive host-based telemetry provides defenders with a rich source of data from which to build detection and alerting logic.
Links and References
- With a recent pull request to the Sigma project, Sigma is now able to handle generic rule conversions for Zeek logs, if you have Zeek logs flowing to ArcSight, Splunk or Elastic, take a look at this pull request: and corresponding Sigma rules:
- Mitre Bzar has some really useful Zeek detection logic mapped to ATT&CK categories.The following reference is a useful rpcclient refresher.
- I’m a huge fan of this post by Jared Atkinson on Capability Abstraction which really helped me frame my thinking for this post.
- Mimikatz RPC Server/Client reference by ADSecurity
- A Microsoft resource document providing more information regarding the ept_map RPC method.
- An amazing resource by Johnny Johnson looking at RPC telemetry at the host and network level.
- Idaho National Labs’ Malcolm – the powerful, easily deployable network traffic analysis tool suite for full packet capture artifacts (PCAP files) and Zeek logs referenced in the blog.
Anton is a BSides Toronto speaker, C3X volunteer, and an OSCE, OSCP, CISSP, CSSP certificate holder. Anton enjoys the defensive aspects of cybersecurity and loves logs and queries.