Intro
One of the aspects of defending enterprises that humbles me the most is scale. Enabling different logging and sending those logs to some kind of centralized SIEM device sounds relatively straight forward at a high-level, but dealing with tens or even hundreds of thousands of endpoints presents us with huge challenges.
In this post, I wanted to highlight a feature in Splunk that helps – at least in part – address the challenge of hunting at scale: data models and tstats.
What are data models?
According to Splunk’s documents, data models are:
A data model is a hierarchically structured search-time mapping of semantic knowledge about one or more datasets. It encodes the domain knowledge necessary to build a variety of specialized searches of those datasets. These specialized searches are used by Splunk software to generate reports for Pivot users.
Another, more accessible way that I had this explained to me was that data models take unstructured data and make it structured
What benefit does this give us? Speed!
Accelerated searches using Splunk data models return results almost instantly, even across large data sets.
Setup
I won’t go into huge detail about how to set up Splunk and data models, but you will need the following to get started:
-
A Splunk Enterprise Installation of some kind
-
A Splunk TA app that sends data to Splunk in a CIM (Common Information Model) format
-
The Windows and Sysmon Apps both support CIM out of the box
-
-
The Splunk CIM app installed on your Splunk instance configured to accelerate the right indexes where your data lives
In my example, I’ll be working with Sysmon logs (of course!)
Something to keep in mind is that my CIM acceleration setup is configured to accelerate the index that only has Sysmon logs if you are accelerating an index that has both Sysmon and other types of logs you may see different results in your environment.
Queries
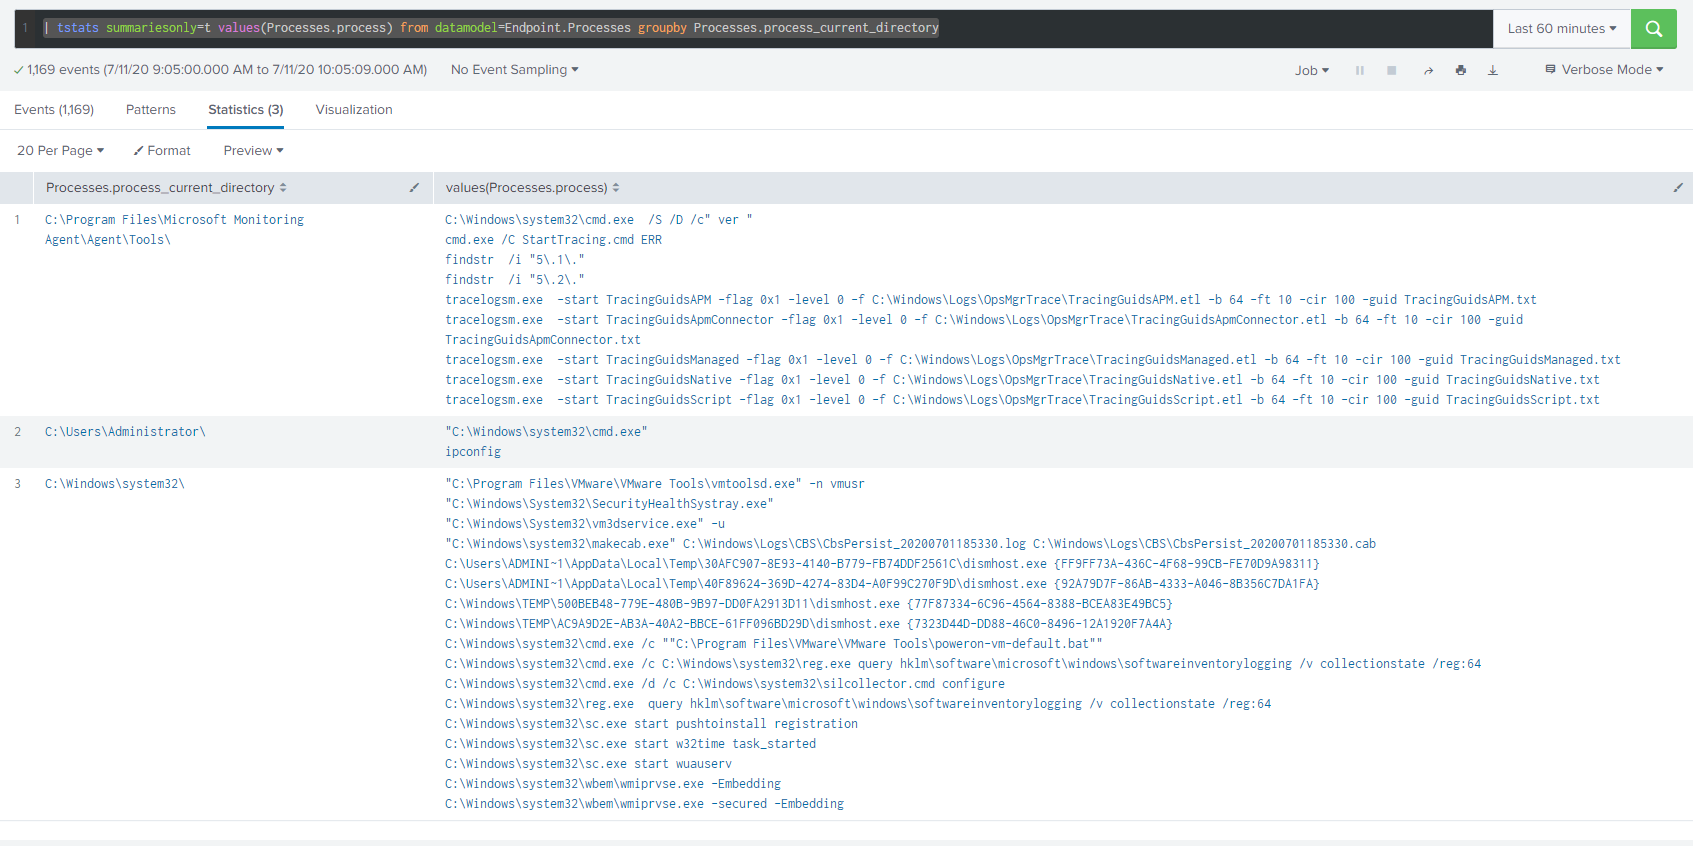
Let’s dive right into some queries using data models, for my first example, I want to keep it simple and run a query that will show which directories processes are launching from.
tstats summariesonly=t values(Processes.process) from datamodel=Endpoint.Processes groupby Processes.process_current_directory
This looks a bit different than a traditional stats based Splunk query, but in this case, we are selecting the values of “process” from the Endpoint data model and we want to group these results by the directory in which the process executed. This gives us results that look like:
The biggest advantage to data models is speed, so let’s try to set the time further back so we can pull more data and see how long it takes, running the same search for a period of “All Time” in my small test instance produced the following results:

Super. Fast.
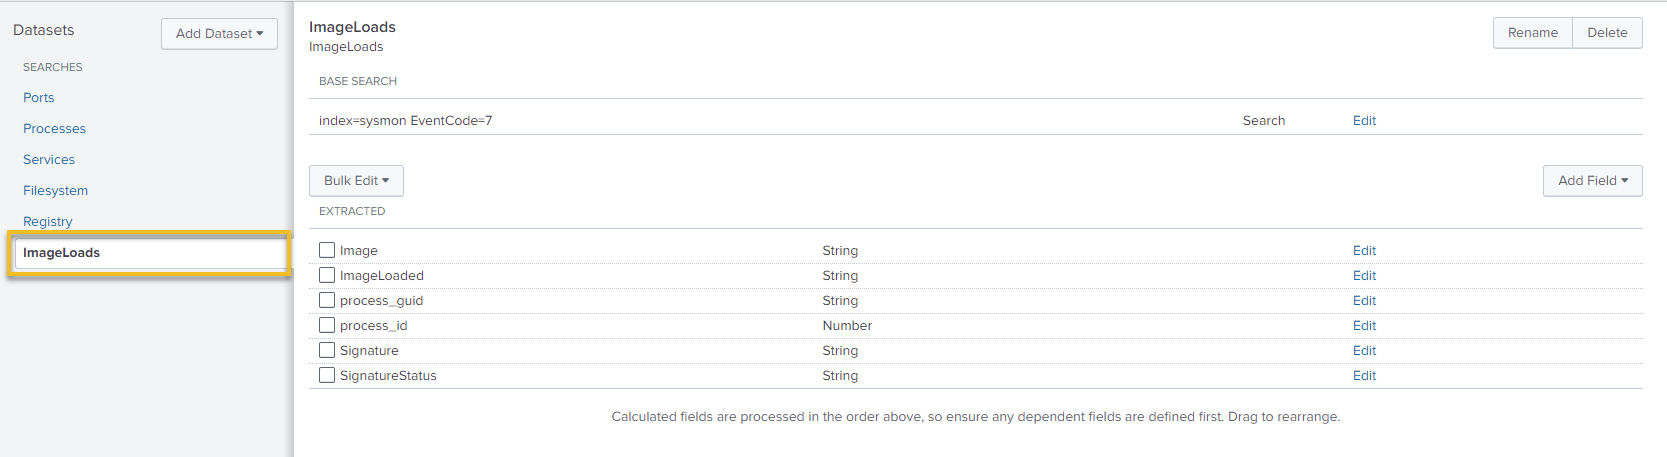
By default, the CIM App has field mappings for certain Sysmon events but not every single field is mapped to a data model. If we wanted to look at ImageLoad events, for example, we would need to create our own data model under the existing Endpoint data model
Now with our new data model, we can run a query like:
| tstats summariesonly=t values(ImageLoads.ImageLoaded) from datamodel=Endpoint.ImageLoads groupby ImageLoads.Image
And get results that look like:
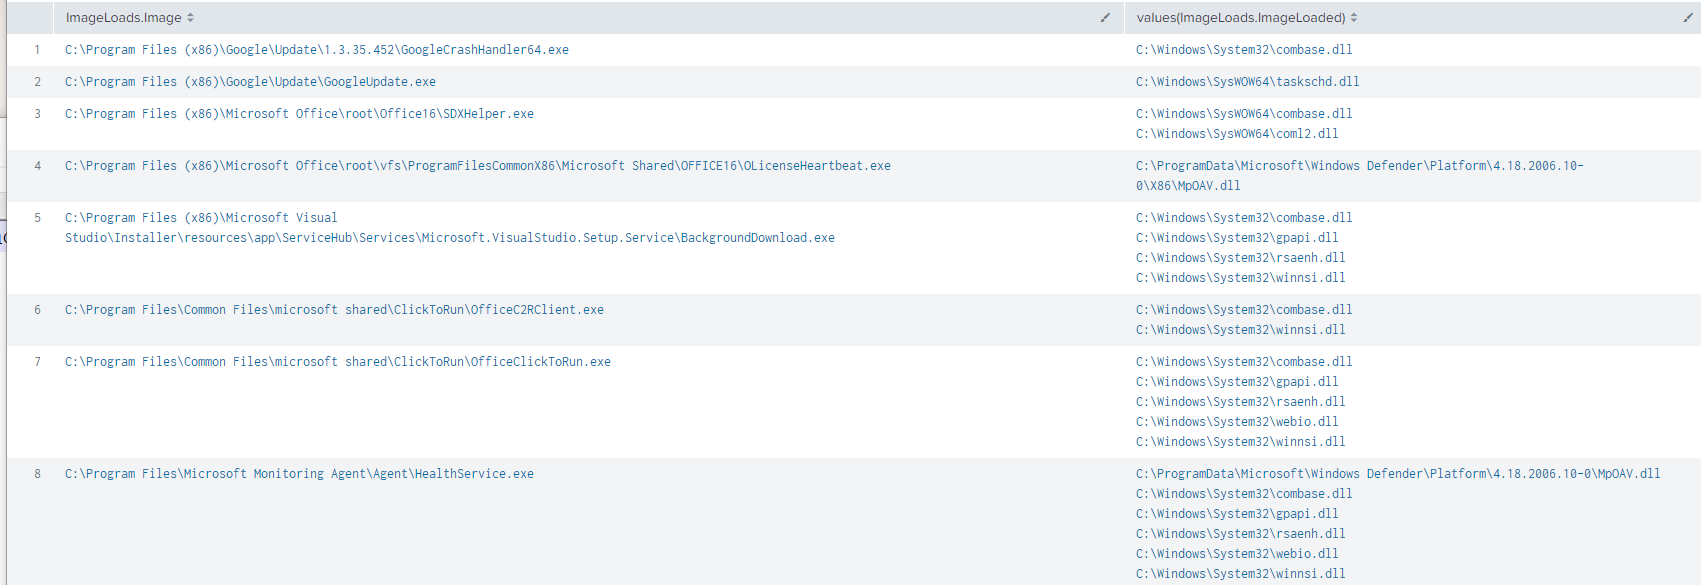
This gives us a nice view of what DLLs were loaded by particular processes, with results returned to us almost instantly across large data sets – cool!
Let’s continue and look at Sysmon ProcessAccess events, I followed the same procedure as outlined above and made a new data model for the ProcessAccess events and now I can do something like:
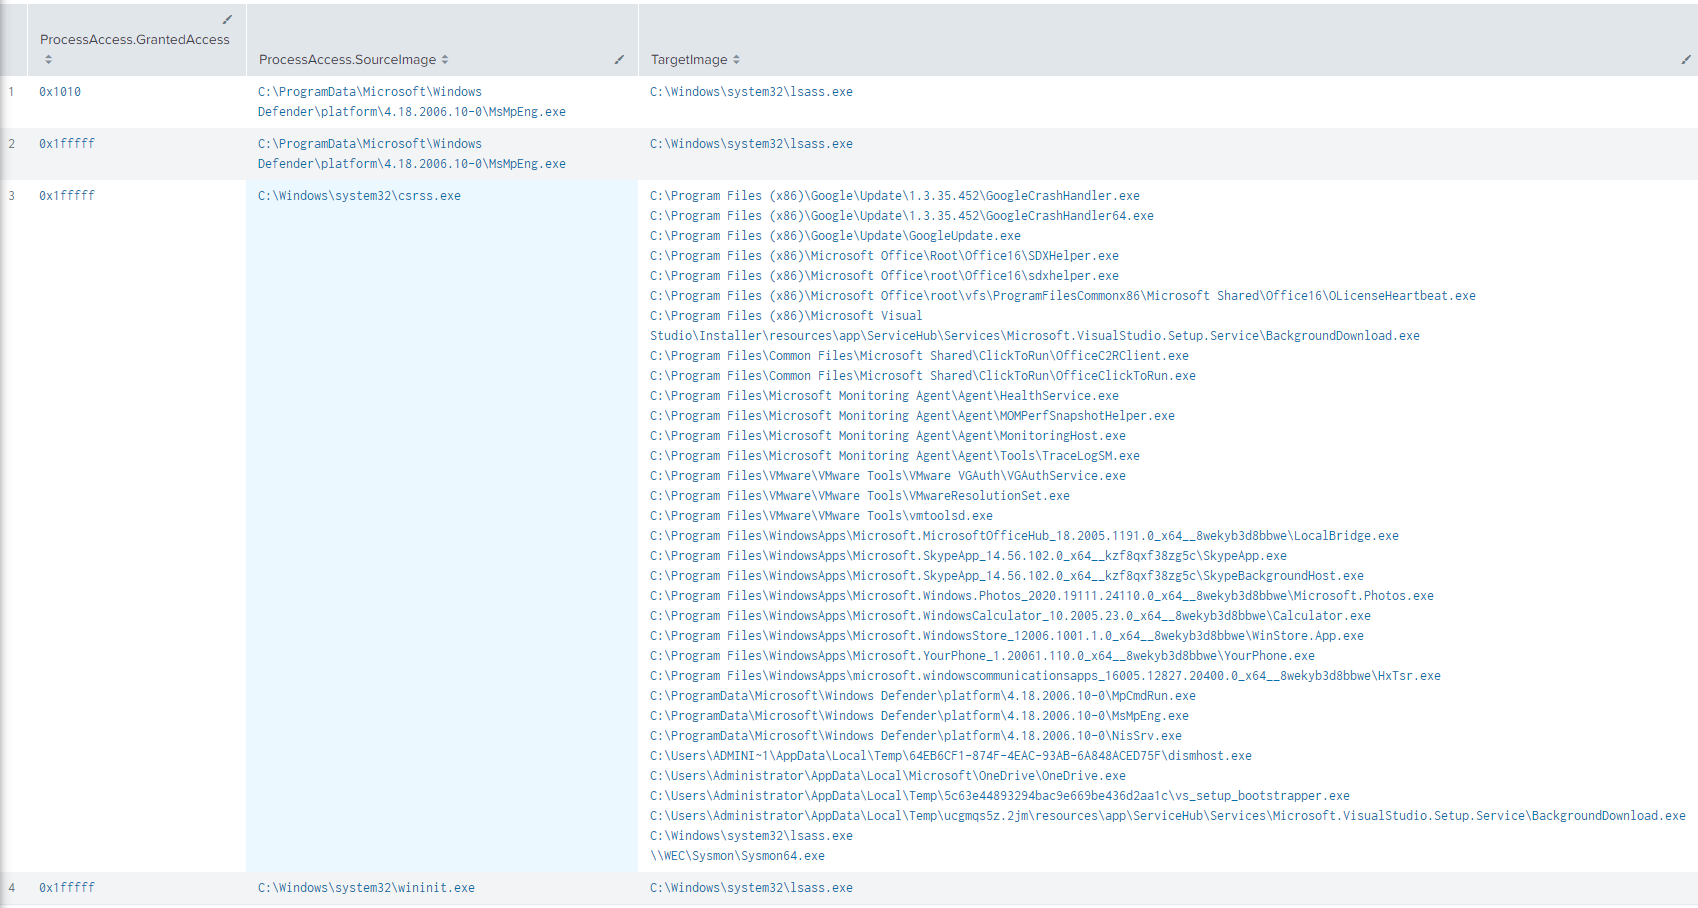
| tstats summariesonly=t values(ProcessAccess.TargetImage) from datamodel=Endpoint.ProcessAccess groupby ProcessAccess.GrantedAccess,ProcessAccess.SourceImage
Which produces this result:
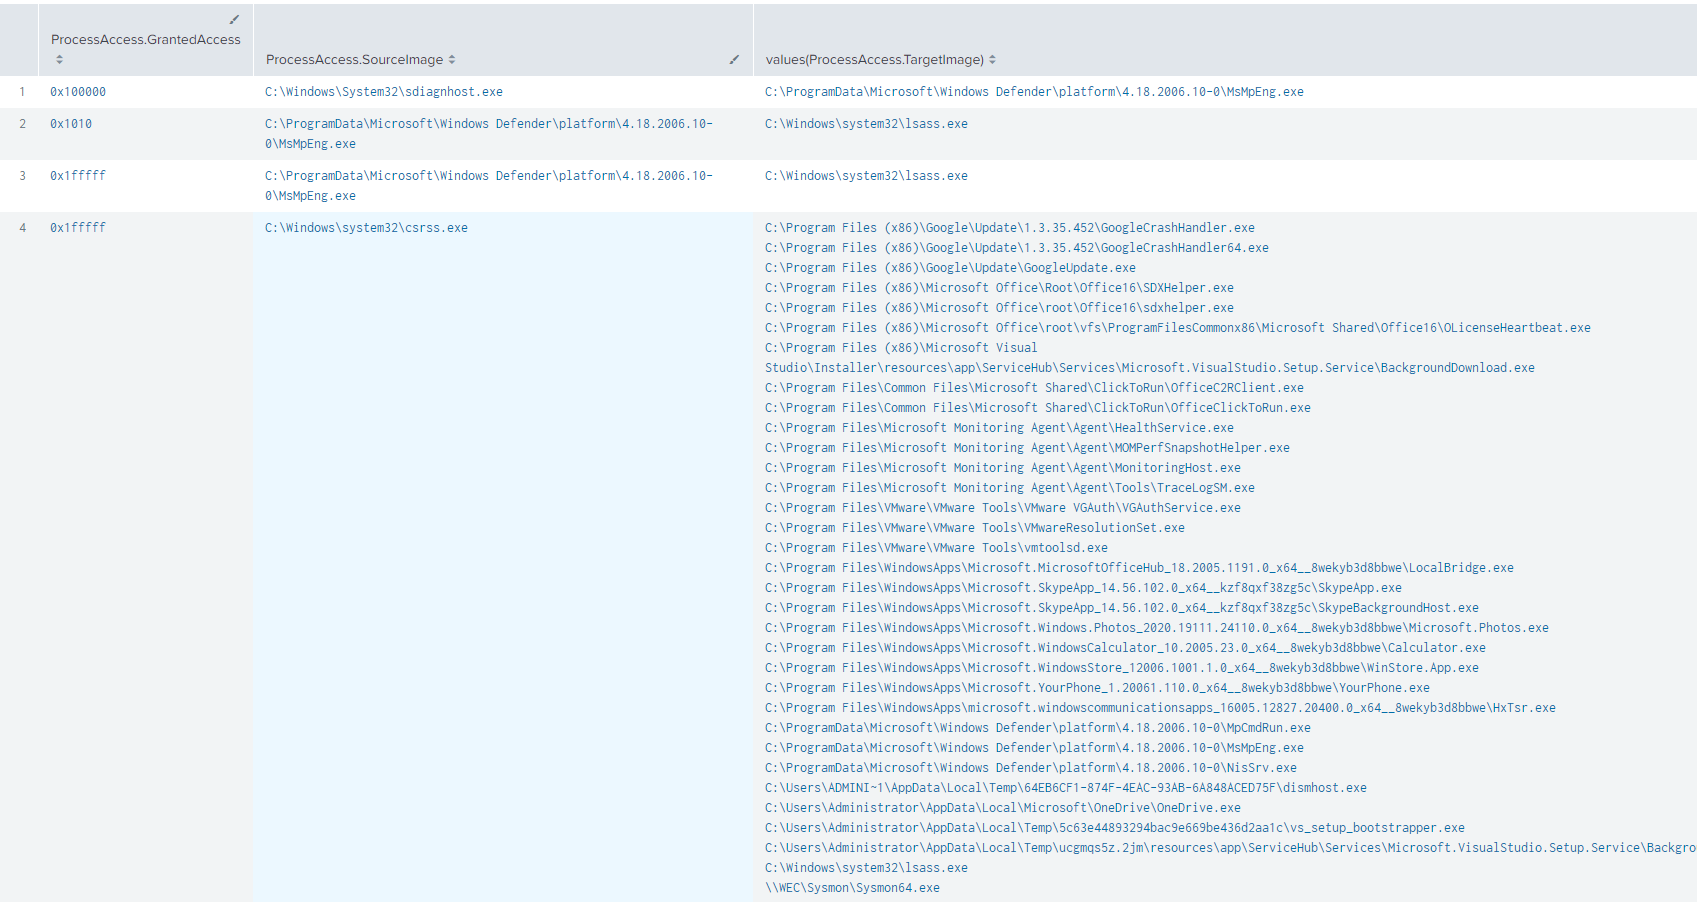
A really useful view for quickly grouping your Sysmon ProcessAccess events by the AccessGranted field, useful if you’re trying to quickly hunt on anomalous GrantedAccess values.
If we wanted to quickly narrow down the above search to show us what is injecting into LSASS we can do so with the following:
| tstats summariesonly=t values(ProcessAccess.TargetImage) as "TargetImage" from datamodel=Endpoint.ProcessAccess groupby ProcessAccess.GrantedAccess,ProcessAccess.SourceImage
| search TargetImage = *lsass*
Which produces:
We can also apply the same idea to quickly hunt for anomalous values in the CallTrace, with a query that looks something like:
| tstats summariesonly=t values(ProcessAccess.CallTrace) AS "CallTrace", values(ProcessAccess.SourceImage) AS "SourceImage" from datamodel=Endpoint.ProcessAccess groupby ProcessAccess.TargetImage
| eval CallTrace=split(CallTrace,"|")
| rename ProcessAccess.TargetImage AS "TargetImage"
| table SourceImage,TargetImage,CallTrace
Which gives us the following:
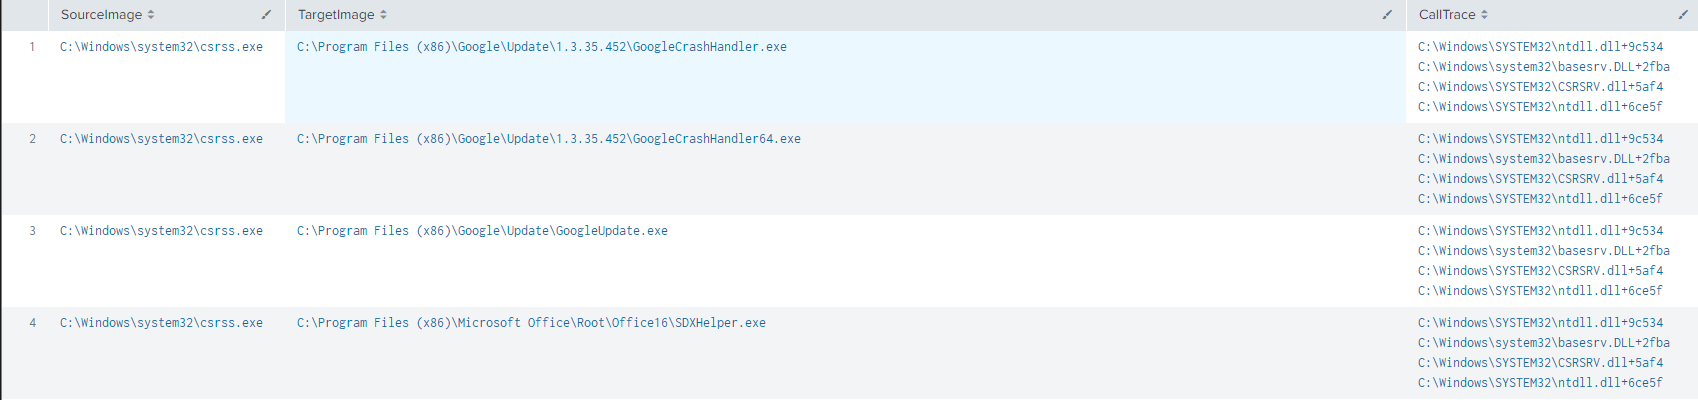
This gives us a pretty clear picture of what processes are injecting where and what the corresponding call trace’s look like, we can expand on this concept a bit further with something like:
| tstats summariesonly=t values(ProcessAccess.CallTrace) AS "CallTrace", values(ProcessAccess.SourceImage) AS "SourceImage" from datamodel=Endpoint.ProcessAccess groupby ProcessAccess.TargetImage
| eval CallTrace=split(CallTrace,"|")
| eval CallTraceTranslate=case(CallTrace="C:\Windows\SYSTEM32\ntdll.dll+9c534","NTOpenProcess")
| rename ProcessAccess.TargetImage AS "TargetImage"
| table SourceImage,TargetImage,CallTrace,CallTraceTranslate
Which produces the following results:
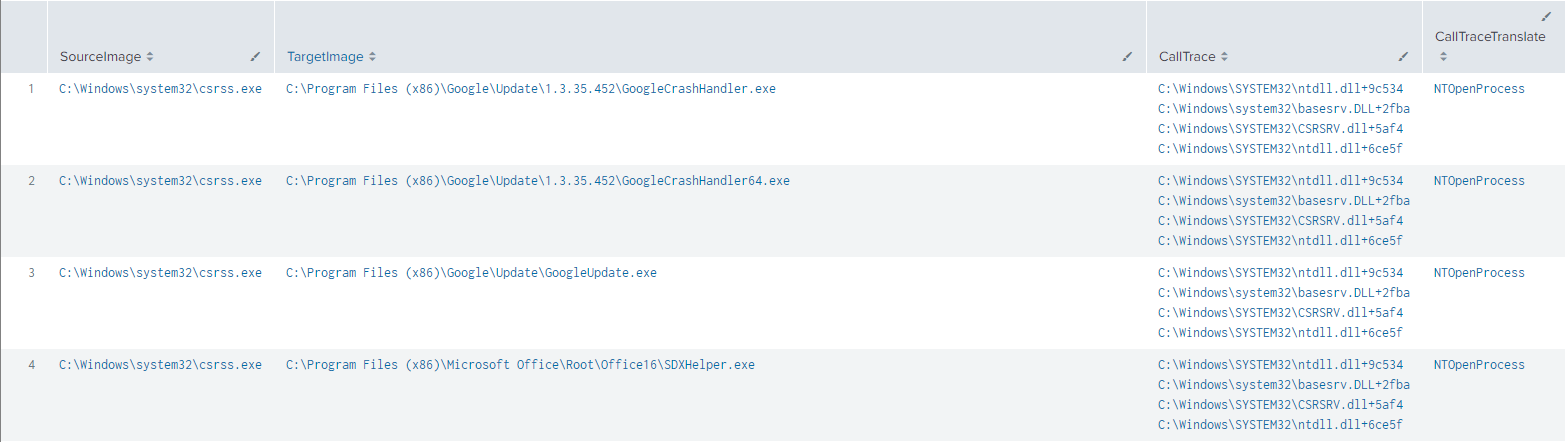
This query is splitting the CallTrace field up via it’s “|” delimiter and then translating a line of the Call Trace to a human-readable format, this should make it easier to spot weird values in the Call Trace field.
tstats and Dashboards
I’m a bit of a rebel and like to use Splunk dashboards not just for visualizations, but to give myself a quasi hunting GUI, putting together some of the queries we went over above, we can build out a simple dashboard that looks like:
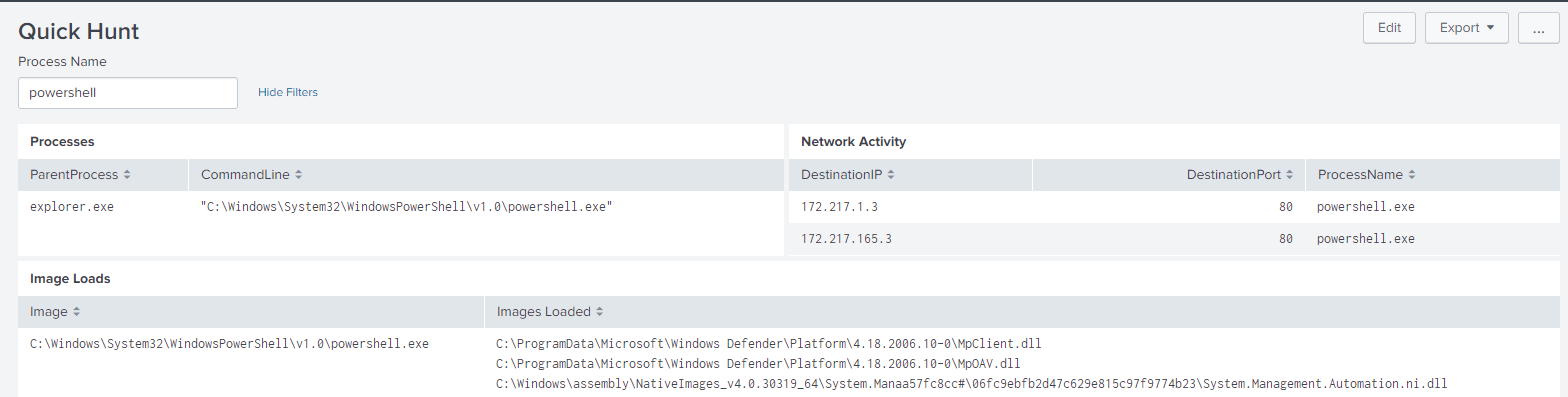
The idea here is that I can just enter a process name that I’m interested in quickly, and then that token is passed to three separate searches, all using data models on the back-end for almost instant results.
Let’s add another search to our dashboard that glues ProcessCreate and NetworkConnect events together.
We can start with the following tstats query:
| tstats summariesonly=t prestats=t values(Processes.process),values(Processes.parent_process),values(Processes.process_current_directory) from datamodel=Endpoint.Processes WHERE Processes.process_guid="*0d6bac9c-0811-5f0b-0d01-000000001c00*" by Processes.process_guid
| tstats summariesonly=t append=t prestats=t values(Ports.dest),values(Ports.src),values(Ports.dest_port) from datamodel=Endpoint.Ports WHERE Ports.process_guid="*0d6bac9c-0811-5f0b-0d01-000000001c00*" by Ports.process_guid
| rename Ports.process_guid as GUID Processes.process_guid as GUID
| stats values(Ports.dest),values(Ports.src),values(Ports.dest_port),values(Processes.process),values(Processes.process_current_directory),values(Processes.parent_process)
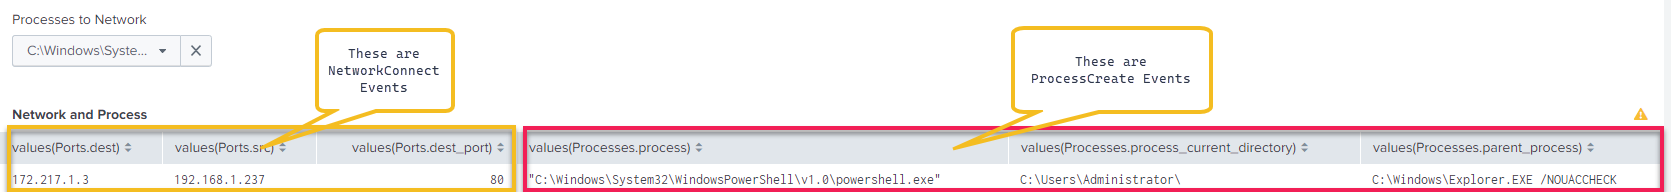
This gives us results which look something like:

I love viewing events in this manner as it gives me a really clear picture of what happened on the host: PowerShell was launched via Explorer, in the C:\Users\Administrator directory and then made some network connections. This query, however, specifies a GUID, what if we wanted to select one from an existing list?
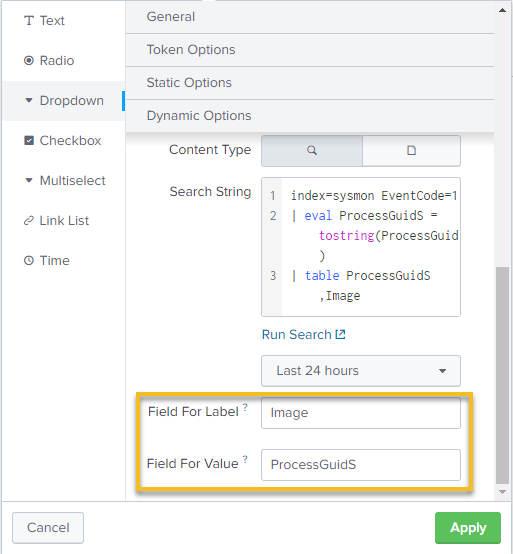
Let’s add a dropdown to our Dashboard that pulls Process and GUID information from Sysmon Event ID 1 events:
We select the Dropdown option, give our field a label, add a token which will be passed to our search and then set the label for the field to be a process name, but the value of the field to be a Process GUID to be passed onto the search:
Now we have a dropdown in our dashboard that gives us a list of processes based on their GUID (so if you launched PowerShell a bunch of times you’ll see multiple instances of PowerShell available for selection)

Now we select the process we’re interested in and view our results:
The code for my entire dashboard is here (Note: You may need to tweak some of your data models to make the searches work in your environment).
<form>
 <label>Quick Hunt</label>
 <fieldset submitButton="false">
 <input type="text" token="process_name_token">
 <label>Process Name</label>
 </input>
 </fieldset>
 <row>
 <panel>
 <table>
 <title>Processes</title>
 <search>
 <query>| tstats summariesonly=t values(Processes.process) from datamodel=Endpoint.Processes where (Processes.process="*$process_name_token$*") groupby Processes.parent_process_name
| rename Processes.parent_process_name AS ParentProcess, values(Processes.process) AS CommandLine</query>
 <earliest>-24h@h</earliest>
 <latest>now</latest>
 </search>
 <option name="drilldown">none</option>
 <option name="refresh.display">progressbar</option>
 </table>
 </panel>
 <panel>
 <table>
 <title>Network Activity</title>
 <search>
 <query>| tstats summariesonly=t values(Processes.process_exec) from datamodel=Endpoint.Processes where (Processes.process_exec="*$process_name_token$*") groupby Processes.DestinationIp,Processes.DestinationPort
| rename Processes.DestinationIp AS DestinationIP, Processes.DestinationPort AS DestinationPort, values(Processes.process_exec) AS ProcessName</query>
 <earliest>-24h@h</earliest>
 <latest>now</latest>
 </search>
 <option name="drilldown">none</option>
 <option name="refresh.display">progressbar</option>
 </table>
 </panel>
 </row>
 <row>
 <panel>
 <table>
 <title>Image Loads</title>
 <search>
 <query>| tstats summariesonly=t values(ImageLoads.ImageLoaded) from datamodel=Endpoint.ImageLoads where (ImageLoads.Image = "*$process_name_token$*") groupby ImageLoads.Image
| rename ImageLoads.Image as "Image", values(ImageLoads.ImageLoaded) as "Images Loaded"</query>
 <earliest>-24h@h</earliest>
 <latest>now</latest>
 </search>
 <option name="drilldown">none</option>
 </table>
 </panel>
 </row>
 <row>
 <panel>
 <input type="dropdown" token="process_guid_token">
 <label>Processes to Network</label>
 <fieldForLabel>Image</fieldForLabel>
 <fieldForValue>ProcessGuidS</fieldForValue>
 <search>
 <query>index=sysmon EventCode=1
| eval ProcessGuidS = tostring(ProcessGuid)
| table ProcessGuidS,Image</query>
 <earliest>-24h@h</earliest>
 <latest>now</latest>
 </search>
 </input>
 <table>
 <title>Network and Process</title>
 <search>
 <query>| tstats summariesonly=t prestats=t values(Processes.process),values(Processes.parent_process),values(Processes.process_current_directory) from datamodel=Endpoint.Processes WHERE Processes.process_guid="*$process_guid_token$*" by Processes.process_guid
| tstats summariesonly=t append=t prestats=t values(Ports.dest),values(Ports.src),values(Ports.dest_port) from datamodel=Endpoint.Ports WHERE Ports.process_guid="*$process_guid_token$*" by Ports.process_guid
| rename Ports.process_guid as GUID, Processes.process_guid as GUID
| stats values(Ports.dest),values(Ports.src),values(Ports.dest_port),values(Processes.process),values(Processes.process_current_directory),values(Processes.parent_process)</query>
 <earliest>-24h@h</earliest>
 <latest>now</latest>
 </search>
 <option name="drilldown">none</option>
 <option name="refresh.display">progressbar</option>
 </table>
 </panel>
 </row>
</form>
In Conclusion…
I am not an SPL master, so there are probably cooler / more efficient ways to re-work the queries I highlighted above. Also, my data model configuration is unique to my test environment, a full-blown production environment will require some engineering elbow grease to get the data that’s in Splunk aligned with CIM.
Finally, although I used Sysmon for my examples, these concepts are also applicable to normal Windows logs or any type of logs that exist in Splunk with fields that fit into a data model.
Thanks for reading!
References
Anton is a BSides Toronto speaker, C3X volunteer, and an OSCE, OSCP, CISSP, CSSP certificate holder. Anton enjoys the defensive aspects of cybersecurity and loves logs and queries.