Intro
Office 365 enables productivity and collaboration among teams and business units. As it’s utilization grows in popularity, productivity tools become increasingly attractive targets to attackers. So often attack chains begin with a successful phishing email. In addition, tools like SharePoint and OneDrive provide adversaries with attractive avenues for both data exfiltration and as a means to extract sensitive information.
This blog shines a light at some of the Office 365 telemetry available and how we can utilize it to get some additional visibility on Office 365 Email, OneDrive, SharePoint and Teams.
For this blog we’ll be using Splunk as well as these two apps:
https://splunkbase.splunk.com/app/3720/
https://splunkbase.splunk.com/app/4055/
Sentinel Office 365 Workbooks will be covered at the end of the blog as well.
Office 365 – Azure – Azure AD
Before diving in with both feet, it might be useful to highlight the distinction between Office 365, Azure and Azure Active Directory.
Although all are Microsoft services, from a telemetry and utilization standpoint, each offer vastly different sets of logs. We find it useful to think of the above services in this manner:
Office 365 = Productivity
Azure = Compute
Azure AD = Identity
This distinction helps frame hunting and alerting strategies, as well as focus on what to look for in the telemetry stemming from these various services.
When thinking about email logs, it’s important to note the differences between the Office 365 Management API data and the data contained in the email trace logs collected by the Microsoft Office 365 Reporting Add-on for Splunk.
The Management API data will give you information regarding mail box operations such as moving and deleting an email and the email trace data will contain sender addresses, subject lines as well as other information regarding sent and received emails.
Let’s take a look at the differences between these two data sources. We’ll be using extremely simplified examples, as it’s difficult to generate a dataset of emails.
One of our favorite Twitter follows is James_inthe_box. James constantly posts information regarding malware campaigns which, with the right data sources, can be quickly operationalized.
Let’s take a look at the following Tweet:
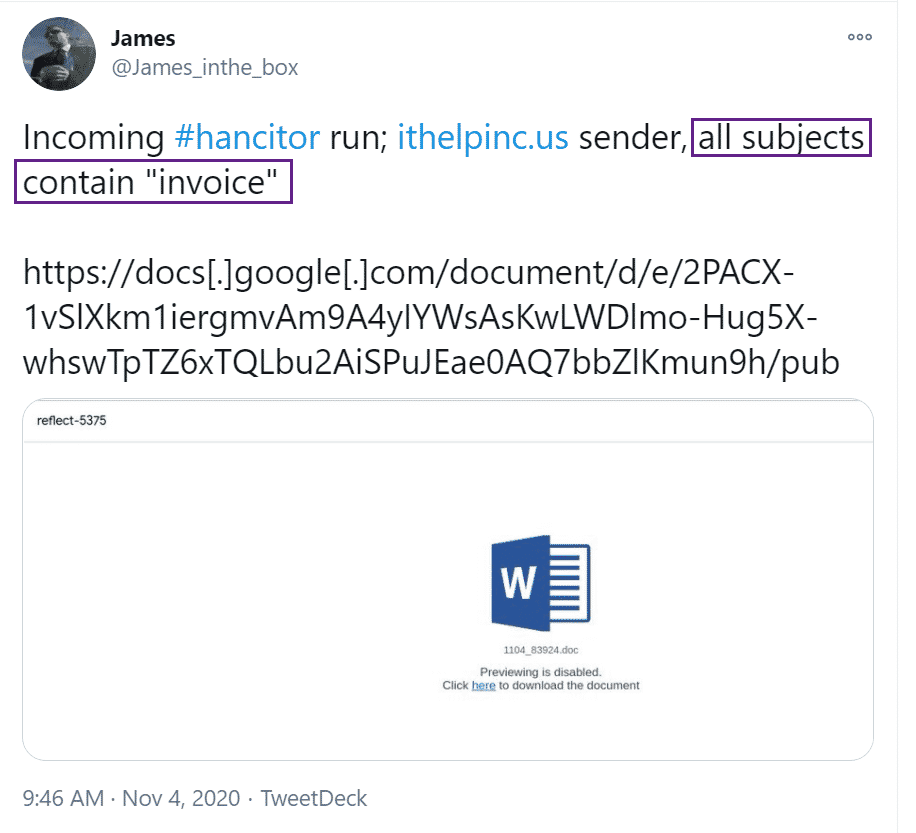
Interesting, a Hancitor malware run and all the subject lines contain "Invoice" – let’s use our email trace data to take a look for this activity, we can do so with the following simple query, where the email index is the index containing your Office 365 Message Trace Data:
index=email subject = *invoice*
| table FromIP,SenderAddress,Status,Subject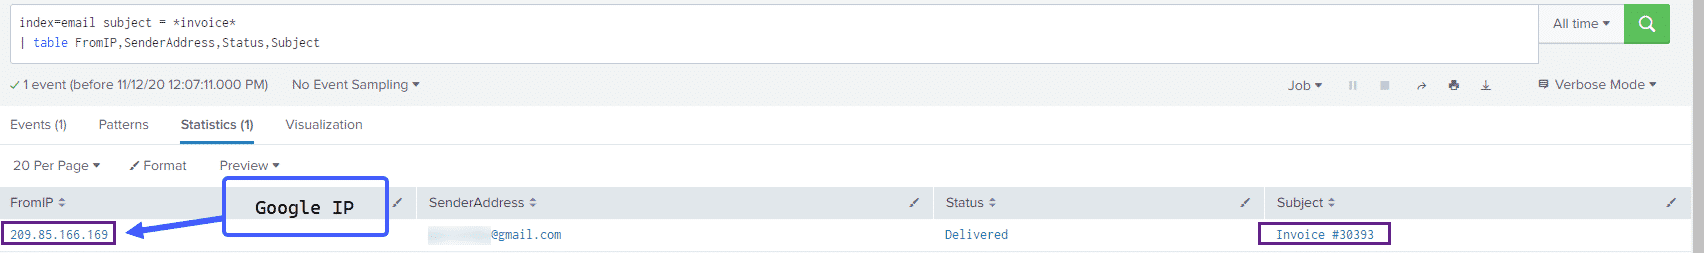
In this case we see that the sender address was GMail and the Sender IP also belongs to Google. Although somewhat difficult to demonstrate with test telemetry, in a real life environment you could match up the domains to the subject lines to determine whether its realistic for certain domains to be sending invoices – a simple yet effective hunting technique.
Using a query like:
index=email
| stats count by Subject,SenderAddress,FromIP,RecipientAddress
We can get a simple overview of which emails were sent to which users:
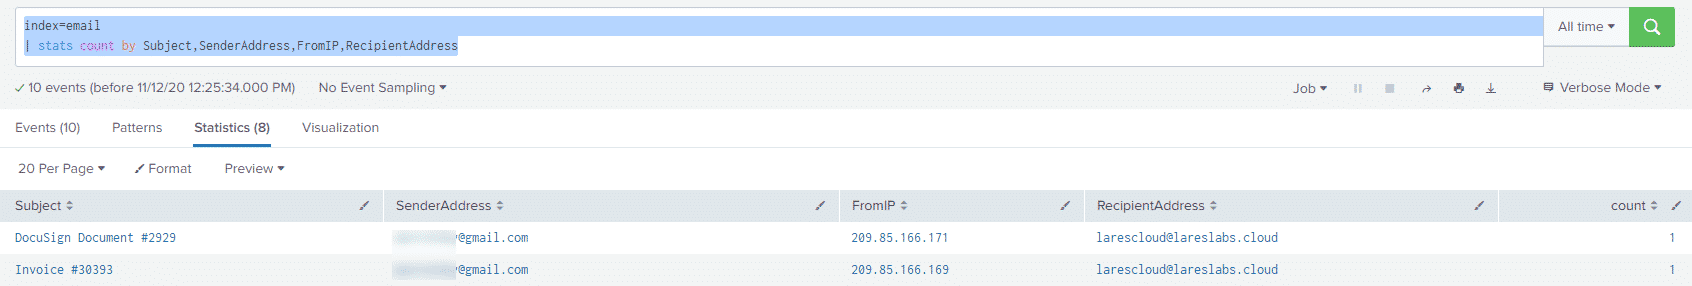
From the above results we can see that an account utilizing GMail sent our LaresCloud user two emails, both containing subject lines that are often used as phishing lures.
In a real world environment, this kind of logic can be used to spot attempts at phishing, as we expect real Invoice and DocuSign themed emails to originate from certain legitimate domains. Similar logic can be used to weed out "package" themed phishing lures, comparing subject lines with key words like "delivery" or various shipping companies to their sending domains.
The message trace logs contain a field named "MessageId" which can be used as a pivot to Exchange logs, in our examples the two Message IDs are:
CAN7sMNsDNGKcqmLx1ZsB3e-_JMRF-VhJY0czxN6tniyOGqJYQA@mail.gmail.com
and
CAN7sMNsJi3BKHTs2o8kkTt70h_mf+3YnNS21YONJq5Z0JkdKog@mail.gmail.com
Now if we use these two fields in our Office 365 logs, we can find out what the user who received these emails did with them:
index=o365 Workload=Exchange "AffectedItems{}.InternetMessageId"="<CAN7sMNsDNGKcqmLx1ZsB3e-_JMRF-VhJY0czxN6tniyOGqJYQA@mail.gmail.com>" OR "AffectedItems{}.InternetMessageId"="<CAN7sMNsJi3BKHTs2o8kkTt70h_mf+3YnNS21YONJq5Z0JkdKog@mail.gmail.com>"
| table Operation,AffectedItems{}.Subject,AffectedItems{}.ParentFolder.Path,DestFolder.Path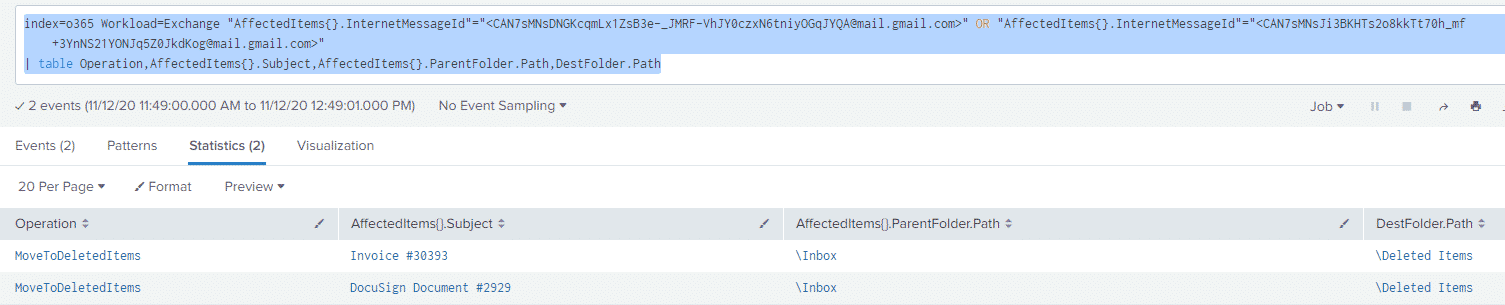
We can see in this case that both emails were moved from the Inbox (ParentFolder.Path) to Deleted Items (DestFolder.Path)
This doesn’t necessarily mean that no action was taken within the links or attachments inside the email, but it is a useful data point to have.
OneDrive
Pretending our fictitious user gets the following email:
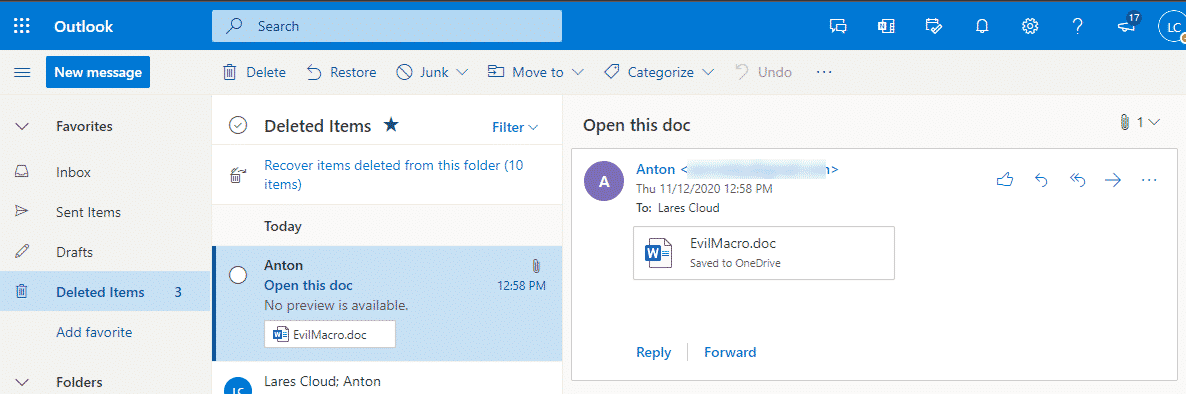
And saves the attachment to their OneDrive – how can we track what happened with the attachment?
Unfortunately in our testing, the Message Trace data did not show that any attachments were present in the above email:
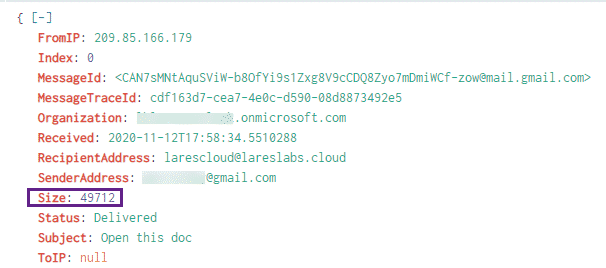
We may be able to ascertain that the email contained an attachment via the Size field, but this is not ideal.
However, we do get some clues if we look at the OneDrive logs with the following query:
index=o365 Workload=OneDrive
| table ItemType,Operation,SourceFileExtension,SourceFileName,SourceRelativeUrl,Workload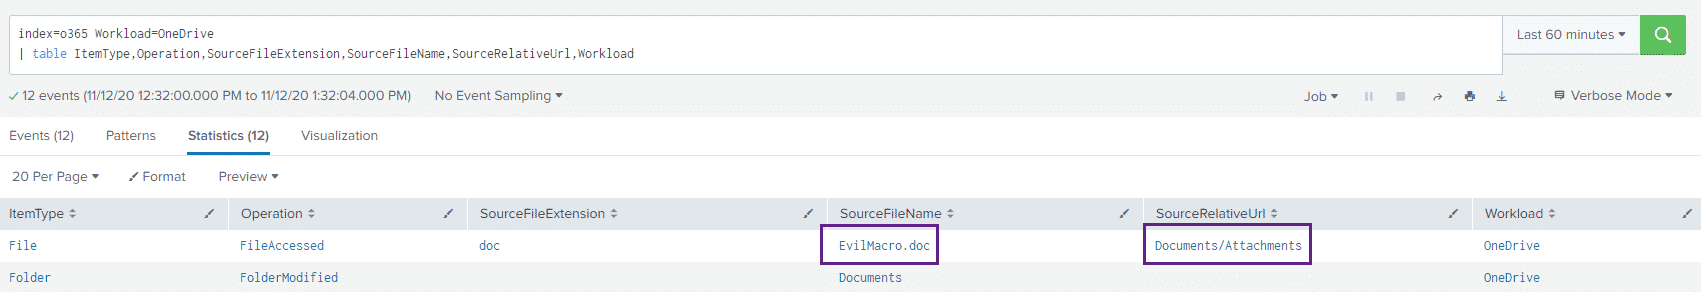
We can see the file name of the attachment that was saved as well as the folder it was saved to, indicating that the source of the file was an attachment.
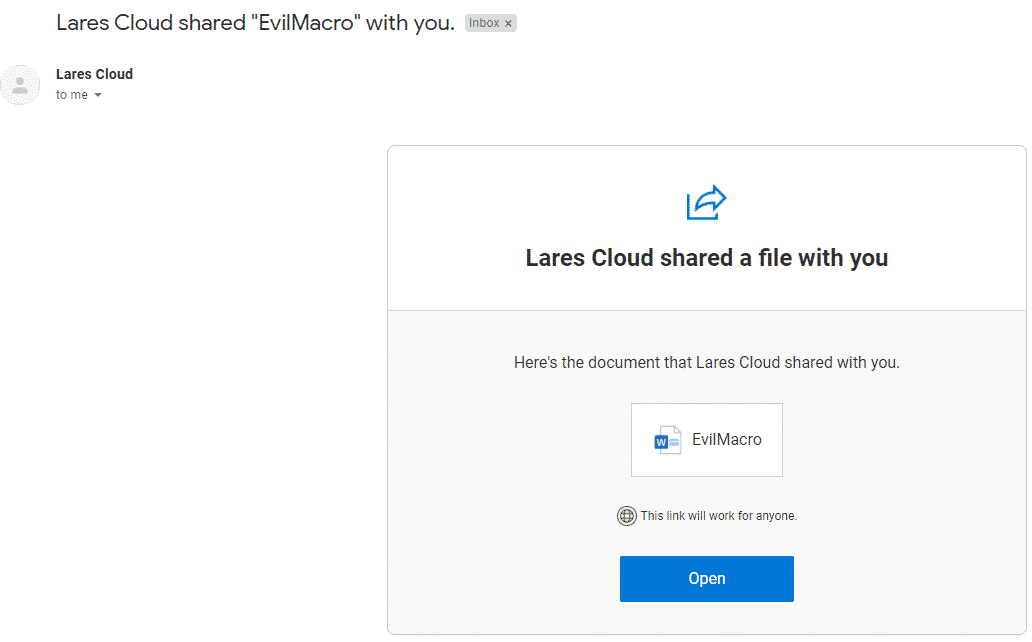
Keeping our focus on this attachment, what if our fictitious user decides to share this document to another email address?
Here’s what that would look like on the receiving end:
We can now find this activity in our Office 365 logs with the following query:
index=o365 Operation=SharingSet
| spath input=EventData
| rename Permissions{@granted} AS Permissions
| stats values(Permissions),values(Operation),values(TargetUserOrGroupName) by SourceFileName
And taking a look at the results:
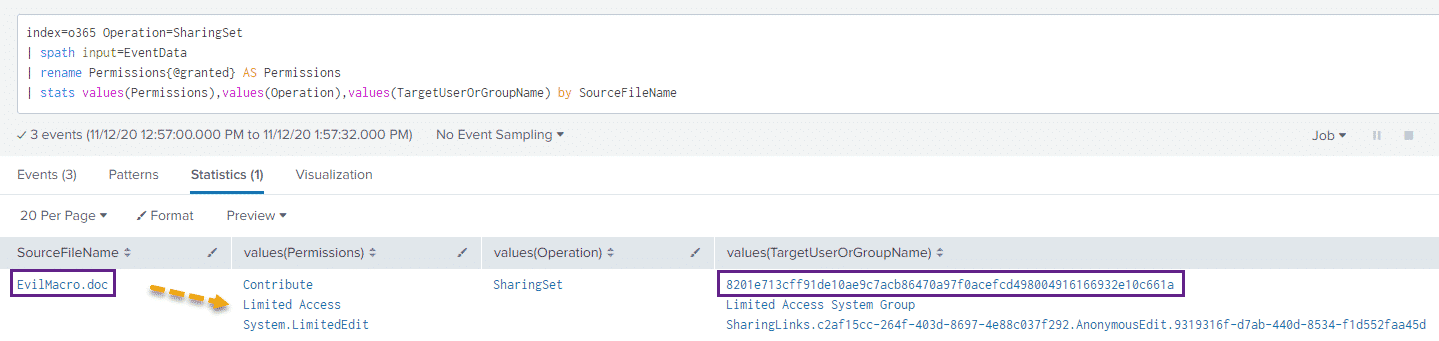
Unfortunately we do not see a value for exactly who this document was shared with, but we can see that it was shared as well as the permissions used to share the file.
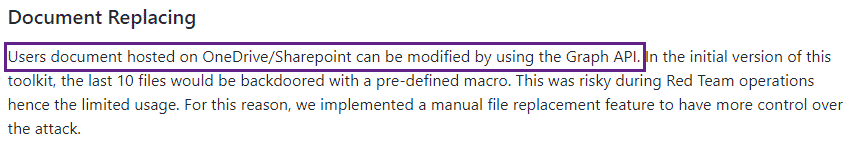
So far we’ve looked at how Office 365 logs can be used to track various user activity and phishing attempts. These logs can also be used to aid in the detection of other malicious activity within your Office 365 tenant, let’s use the Office 365 Toolkit from MDSec as an example ( https://github.com/mdsecactivebreach/o365-attack-toolkit ) One of the features of the Office 365 Toolkit is it’s ability to "backdoor" or replace a file on OneDrive/SharePoint:
Let’s see what this attack looks like in our logging data. We start by phishing our "victim" user and replacing the OneDrive file called "EvilMacro.doc" with our backdoored macro file:
Now let’s take a look at the logs with the following query:
index=o365 Workload=OneDrive Operation=FileModified
| table ItemType,Operation,SourceFileExtension,SourceFileName,SourceRelativeUrl, UserAgent
And checking our results, we see something interesting:
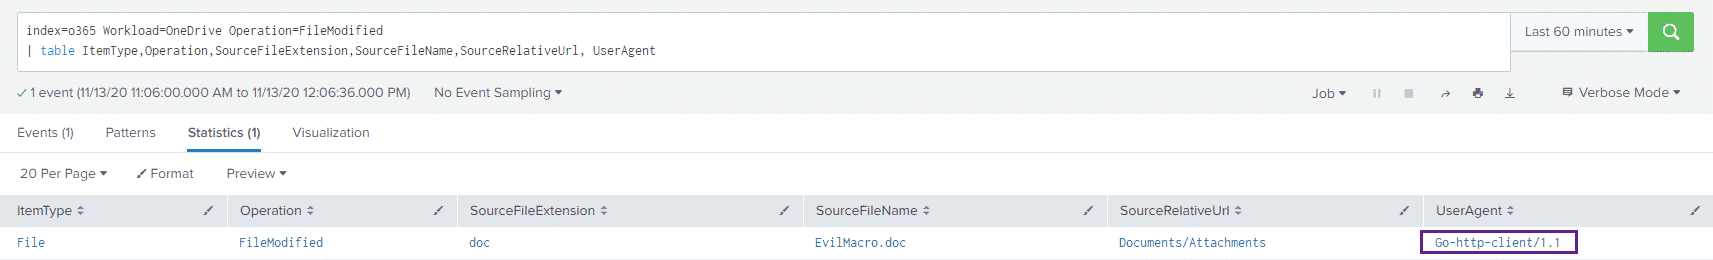
the Go-http-client/1.1
If we take a look at the raw event for the query above, we can see a field named "RecordType":
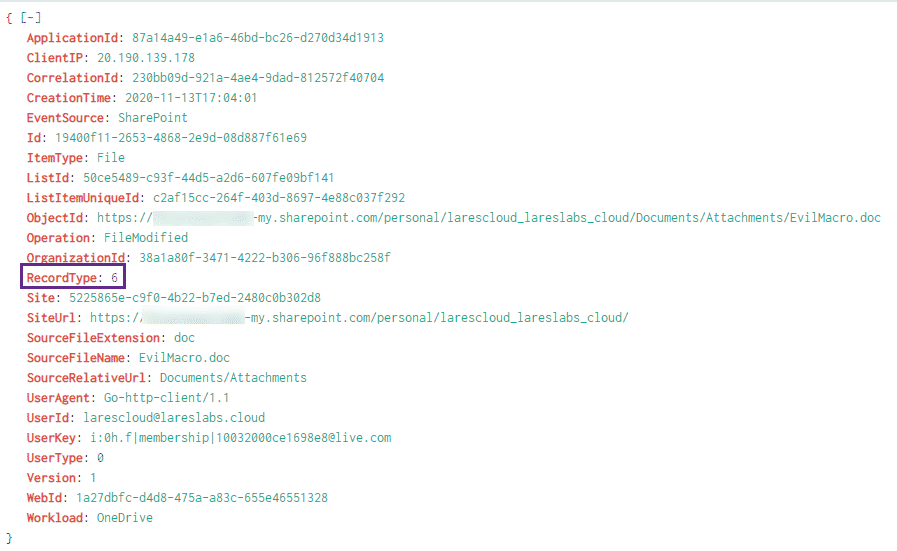
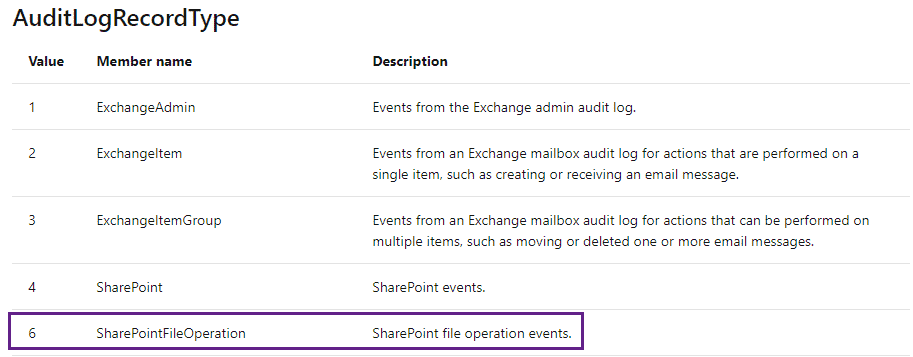
Taking a look at the schema for the Office 365 events ( https://docs.microsoft.com/en-us/office/office-365-management-api/office-365-management-activity-api-schema#auditlogrecordtype ) we can see that a RecordType of 6 is a SharePointFileOperation:
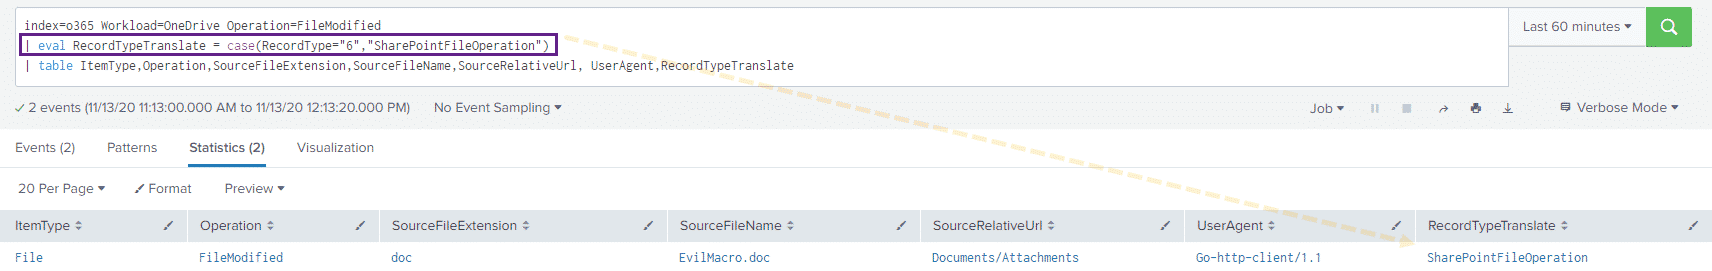
We can edit the query used above to translate this value for us:
index=o365 Workload=OneDrive Operation=FileModified
| eval RecordTypeTranslate = case(RecordType="6","SharePointFileOperation")
| table ItemType,Operation,SourceFileExtension,SourceFileName,SourceRelativeUrl, UserAgent,RecordTypeTranslate
And take a look at the results:
Extracting additional context out of existing logs is always great. Now that we know that we are looking for odd user agents in our logs, we can use a query that looks like:
index=o365
| stats values(Operation),values(Workload),values(UserId),values(SourceFileName) by UserAgent
To sort our data based on the UserAgent value, this should give us a view that looks something like:
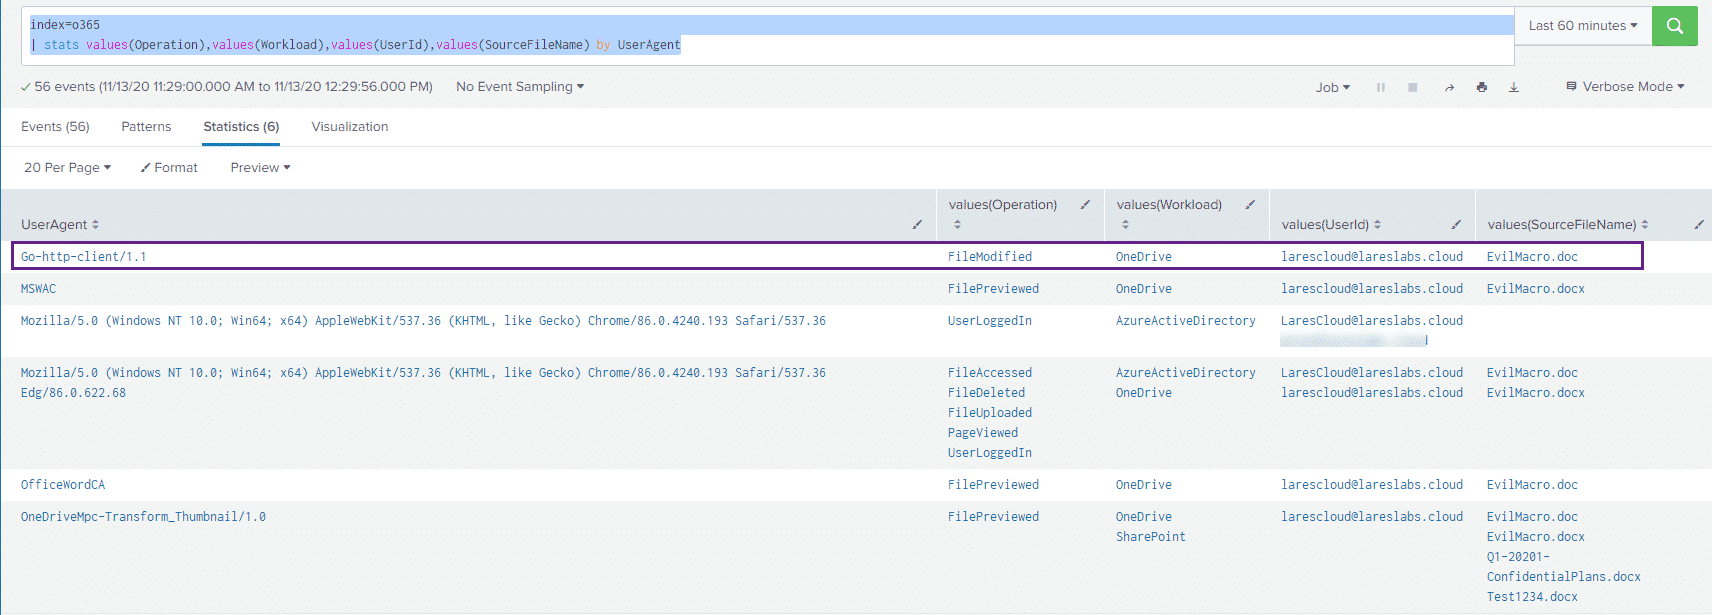
Where we can see our "malicious" user agent sticking out a bit.
Although the source code of the Office attack toolkit can be modified to show a different user agent, the point here is to illustrate what kind of pivoting and baselining can be achieved with Office 365 Telemetry.
SharePoint
SharePoint logging within the Office 365 management telemetry is somewhat verbose and provides us with an excellent base to track SharePoint activity. Let’s pretend we have a file that we know is sensitive on a SharePoint site and want to track access to that file:
We can then use the following query:
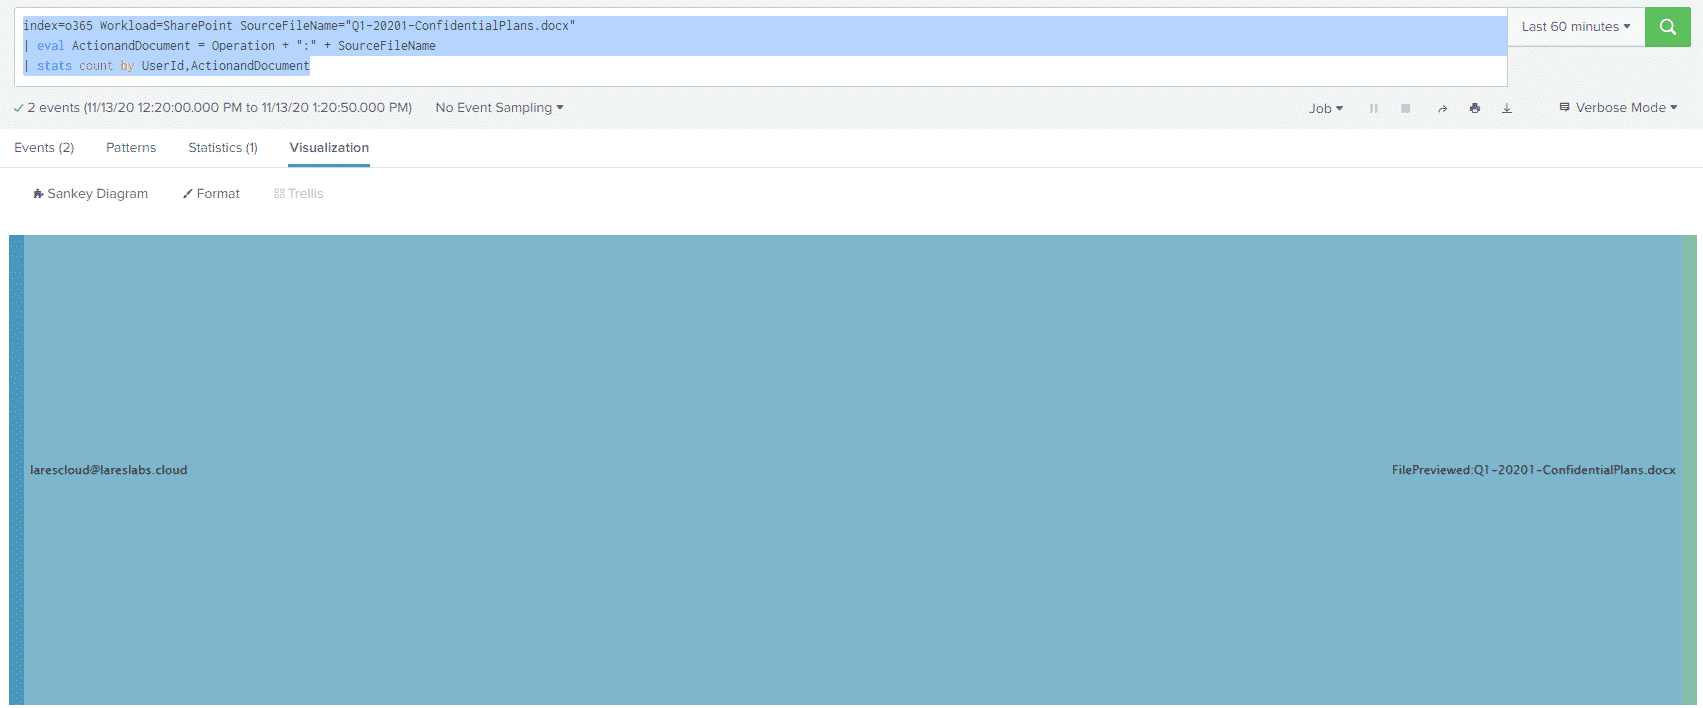
index=o365 Workload=SharePoint SourceFileName="Q1-20201-ConfidentialPlans.docx"
| eval ActionandDocument = Operation + ":" + SourceFileName
| stats count by UserId,ActionandDocument
To generate a Sankey Diagram of which user took which action against our known sensitive file:
We love utilizing Splunk Dashboards to build quick interfaces for hunting / searching through logs, rather than manually building queries.
We can build a simple dashboard that loads the various SharePoint operations into a dropdown, allowing us to select a particular operation to get more information about it. In addition, we can also build a dropdown list of all the files in our SharePoint site to get more information regarding a specific file. Let’s take a look:
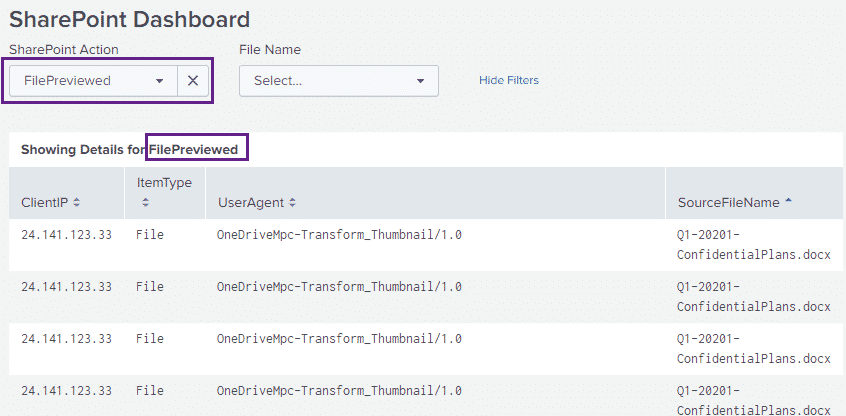
The dropdown on the left hand side contains the various SharePoint actions contained in our logs, we can select a particular action and then get more details about it:
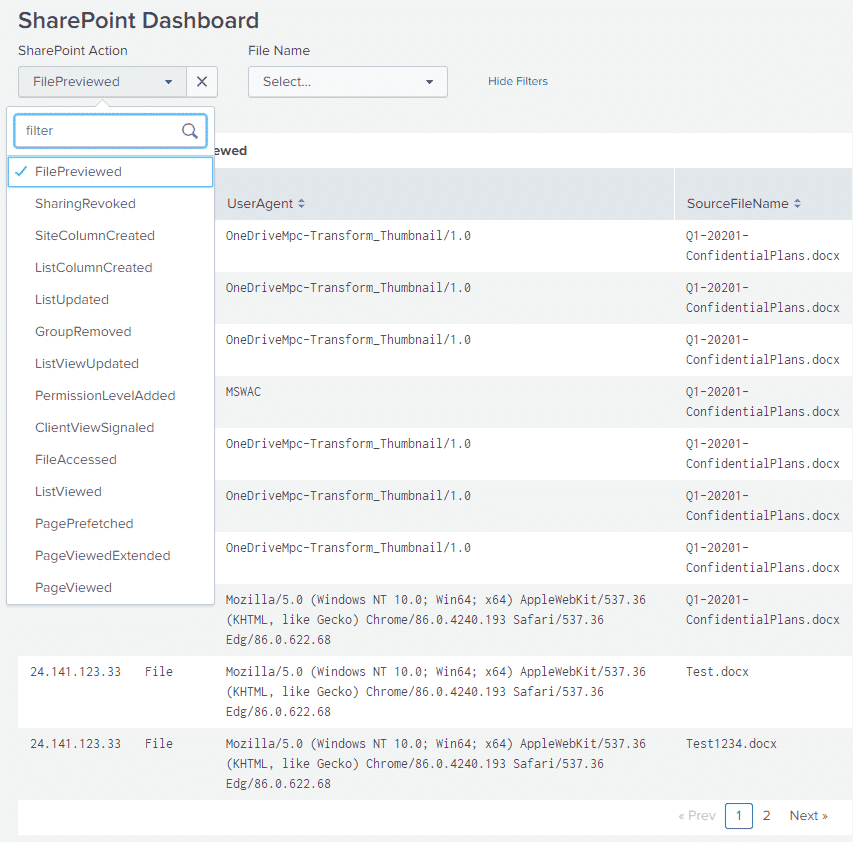
The dropdown on the right hand side contains a list of the files that our logs know about, we can select a file and a pie chart will be generated with the actions that took place on that file:
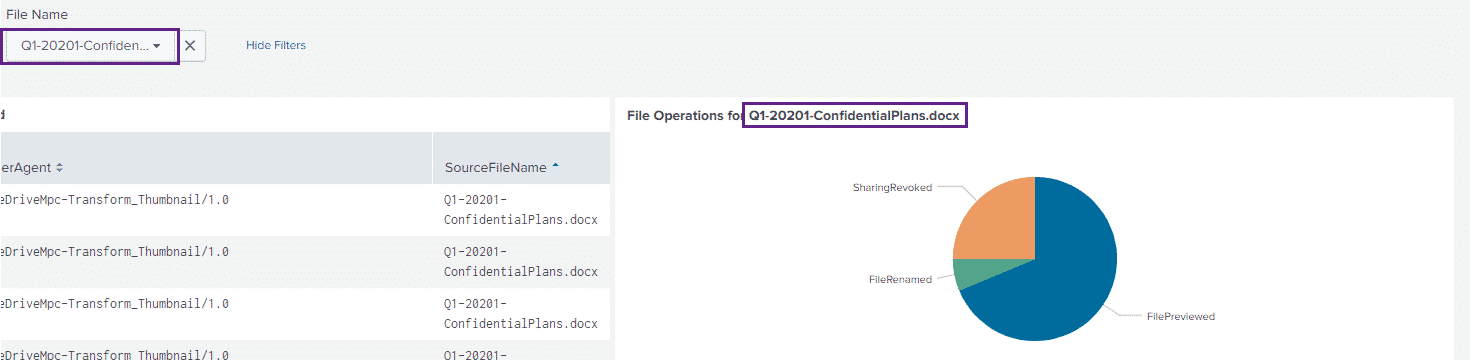
Using dashboards in a tactical manner like this allows us to quickly answer questions that we may have of our data and turns raw logs into something that is operationally useful.
The code for this dashboard is available here:
<form>
  <label>SharePoint Dashboard</label>
  <fieldset submitButton="false">
    <input type="dropdown" token="operation">
      <label>SharePoint Action</label>
      <fieldForLabel>Operation</fieldForLabel>
      <fieldForValue>Operation</fieldForValue>
      <search>
        <query>index=o365 Workload=SharePoint | dedup Operation | table Operation</query>
        <earliest>-24h@h</earliest>
        <latest>now</latest>
      </search>
    </input>
    <input type="dropdown" token="filename" searchWhenChanged="true">
      <label>File Name</label>
      <fieldForLabel>SourceFileName</fieldForLabel>
      <fieldForValue>SourceFileName</fieldForValue>
      <search>
        <query>index=o365 Workload=SharePoint
| dedup SourceFileName
| table SourceFileName</query>
        <earliest>-24h@h</earliest>
        <latest>now</latest>
      </search>
    </input>
  </fieldset>
  <row>
    <panel>
      <table>
        <title>Showing Details for $operation$</title>
        <search>
          <query>index=o365 Workload=SharePoint Operation=$operation$
| fillnull value="-"
| table ClientIP,ItemType,UserAgent,SourceFileName</query>
          <earliest>-24h@h</earliest>
          <latest>now</latest>
        </search>
        <option name="drilldown">none</option>
        <option name="refresh.display">progressbar</option>
      </table>
    </panel>
    <panel>
      <chart>
        <title>File Operations for $filename$</title>
        <search>
          <query>index=o365 Workload=SharePoint SourceFileName=$filename$
| stats count by Operation</query>
          <earliest>-24h@h</earliest>
          <latest>now</latest>
        </search>
        <option name="charting.chart">pie</option>
        <option name="charting.drilldown">none</option>
      </chart>
    </panel>
  </row>
</form>
In addition to building custom dashboards utilizing Office 365 telemetry, you can also utilize the Microsoft 365 App for Splunk which provides pre-built dashboards: https://splunkbase.splunk.com/app/3786/
Teams
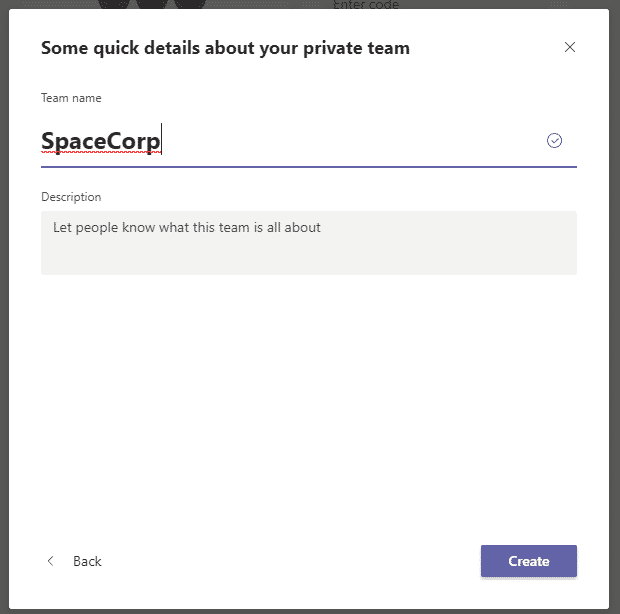
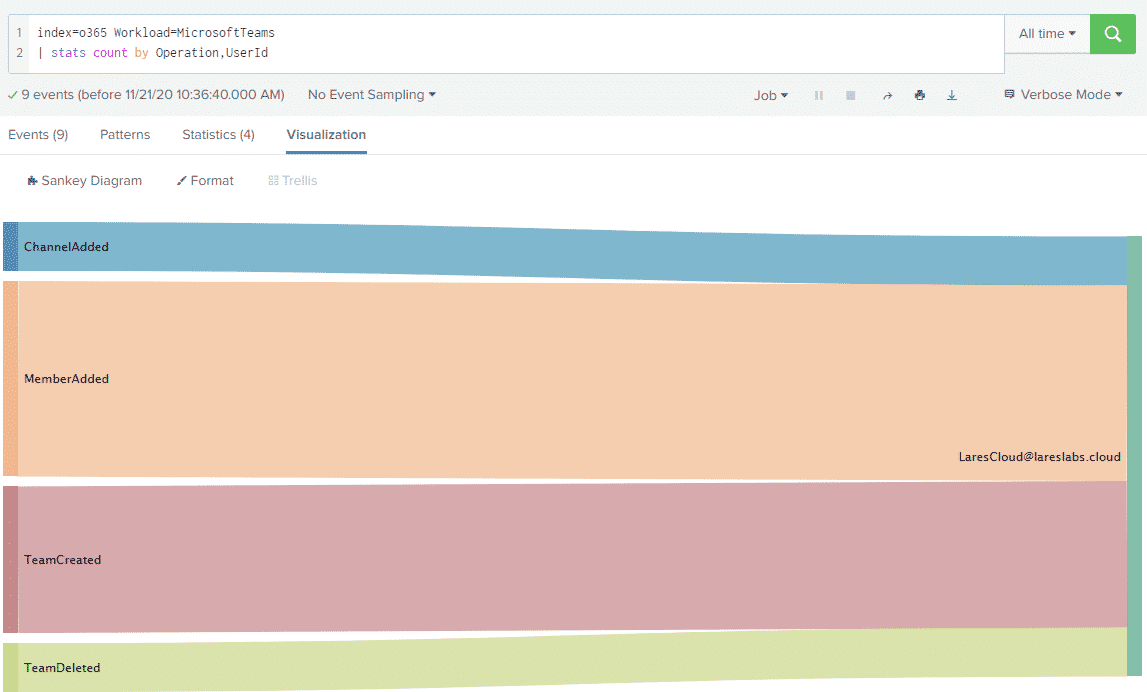
Let’s take a look at the log data that is generated when a user creates a Team. We create our test team:
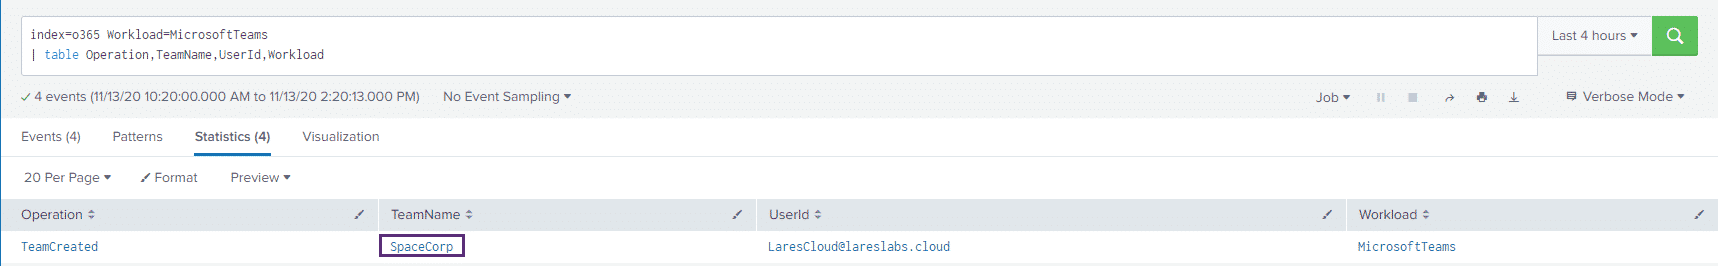
And look at the data with the following query:
index=o365 Workload=MicrosoftTeams
| table Operation,TeamName,UserId,Workload
And we see our results:
When a user adds members to the team, this is logged as well, we can see which users are being added with the following query:
index=o365 Workload=MicrosoftTeams  Operation=MemberAdded
| table Members{}.DisplayName,CommunicationType,ItemName,Operation,TeamName
and check out the results:
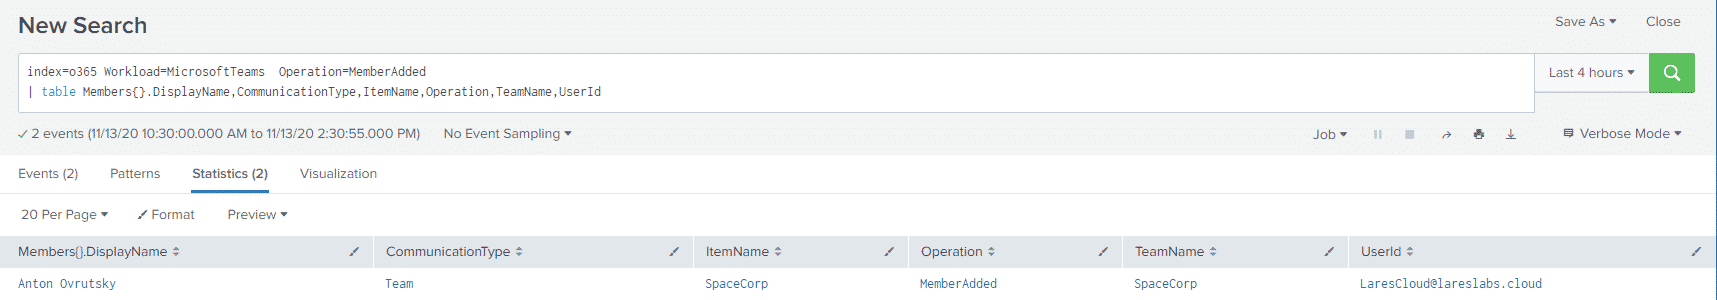
Where the UserId is the user who performed the addition, and the JSON element of Members{}.DisplayName is the user that was added.
Teams telemetry includes other useful data including channel and team operations:
Fun With User Agents
Earlier in this post we noted that we can key off suspicious actions using the user agent field within Office 365 events. More specifically, we looked at the GOLang user agent string when examining the Office 365 Attack Toolkit. How do we find this proverbial needle in the haystack in a more comprehensive manner?
Luckily for us, Alex Teixeria of Opstune shared an extremley useful blog post on identifying rare HTTP user agents in Splunk – you can check the post out here: https://opstune.com/2020/09/16/tracking-rare-http-agent-context-rich-alerts-splunk/ – in the examples below we’ll be adapting some of Alex’s queries to work with Office 365 logs.
Let’s take a look at an example using the cluster command with the following query:
| tstats count from datamodel=Web BY user_agent
| rename Web.* AS *
| cluster t=0.1 labelonly=1 field=user_agent
| stats count AS event_count,dc(user_agent) AS agent_count, values(user_agent) AS agents by cluster_label
The logic here is that we want to cluster events by how similar the user agent field is. We are setting the "t" parameter to 0.1 because we want Splunk to more loosely cluster various user agents as we want to filter out normal browser-based user agents, as Alex describes:
the t parameter (threshold) which controls the sensitivity. The closer it is to 1, the more similar events have to be for them to be considered in the same cluster. In short: lower value = less clusters.So in our case, we want there to be fewer clusters, let’s take a look at our results:
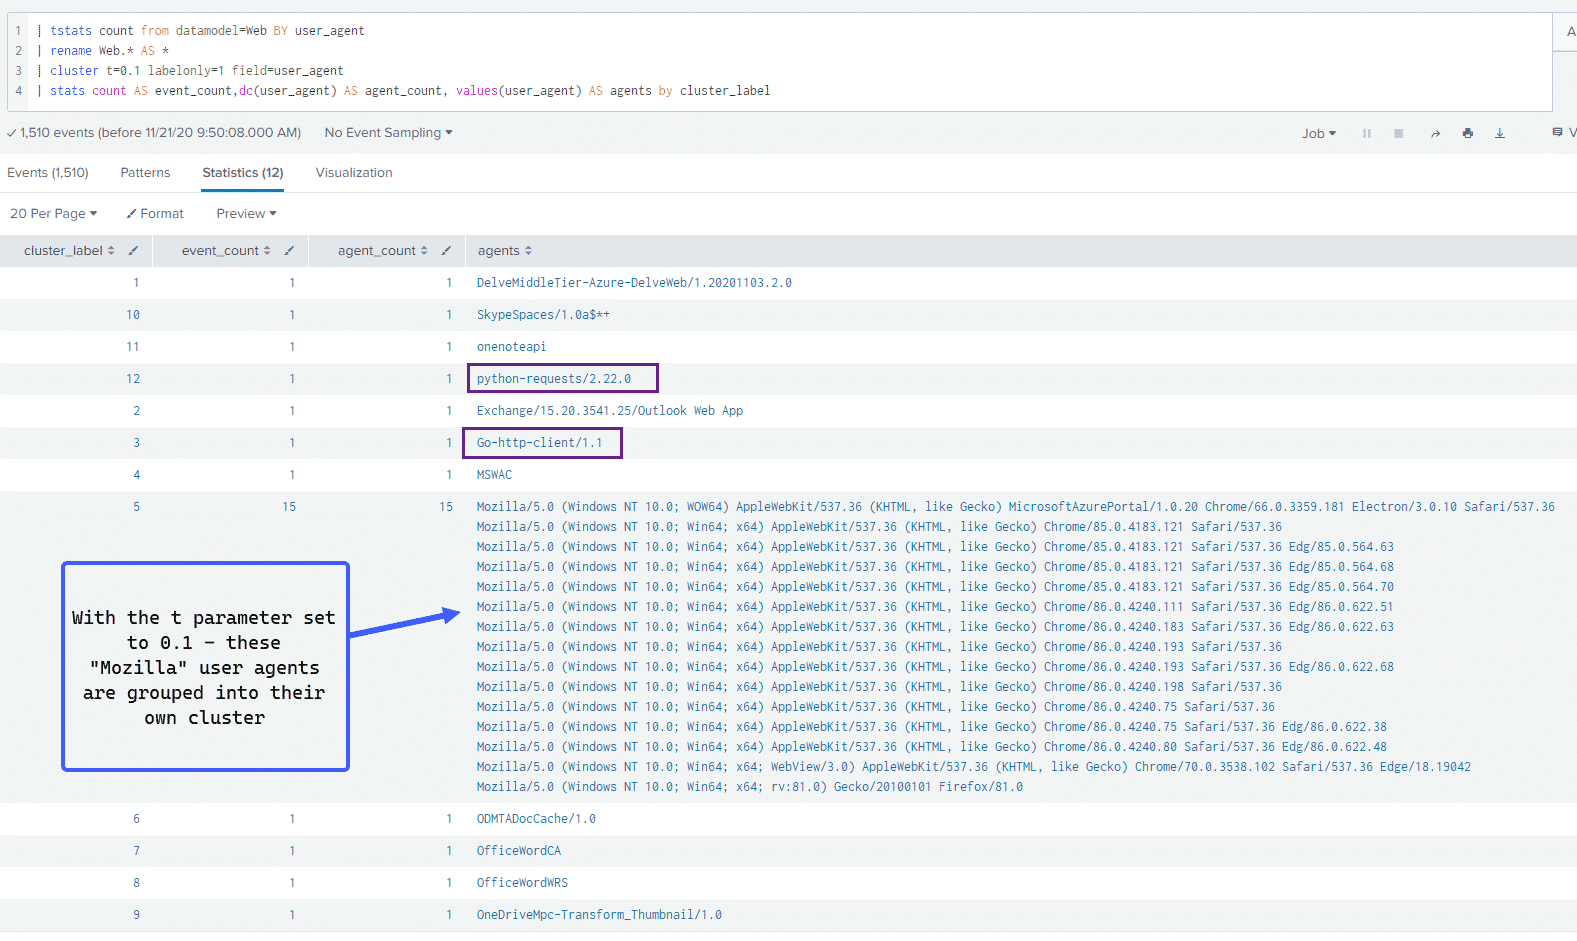
We can see a large cluster of user agents belonging to web browsers with the rest of the results showing unique user agents.
By clustering results in this manner, we can see that other than a large cluster of browser-based user agents and some other user agents belonging to Office 365 and Azure products, the other two that stick out are the Python and GOLang user agents.
Alex’s blog post linked above contains much more comprehensive SPL magic for profiling and clustering user agents. Our goal here was to demonstrate how his detection logic looking at Web Proxy data can apply to Office 365 logs as well.
If your environment contains user agent data of any kind in Splunk, be it through Proxy or Office 365 logs, we would highly recommend taking a close look at his post.
Sentinel
We’re more comfortable working with Splunk, but if you’re a Sentinel user the collection and utilization of this data is relatively straight forward, Sentinel provides a data connector for Office 365 data:
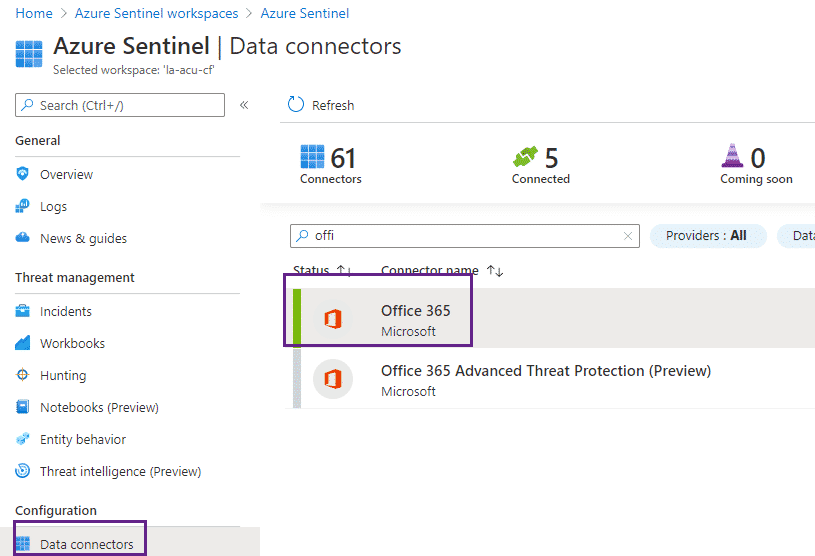
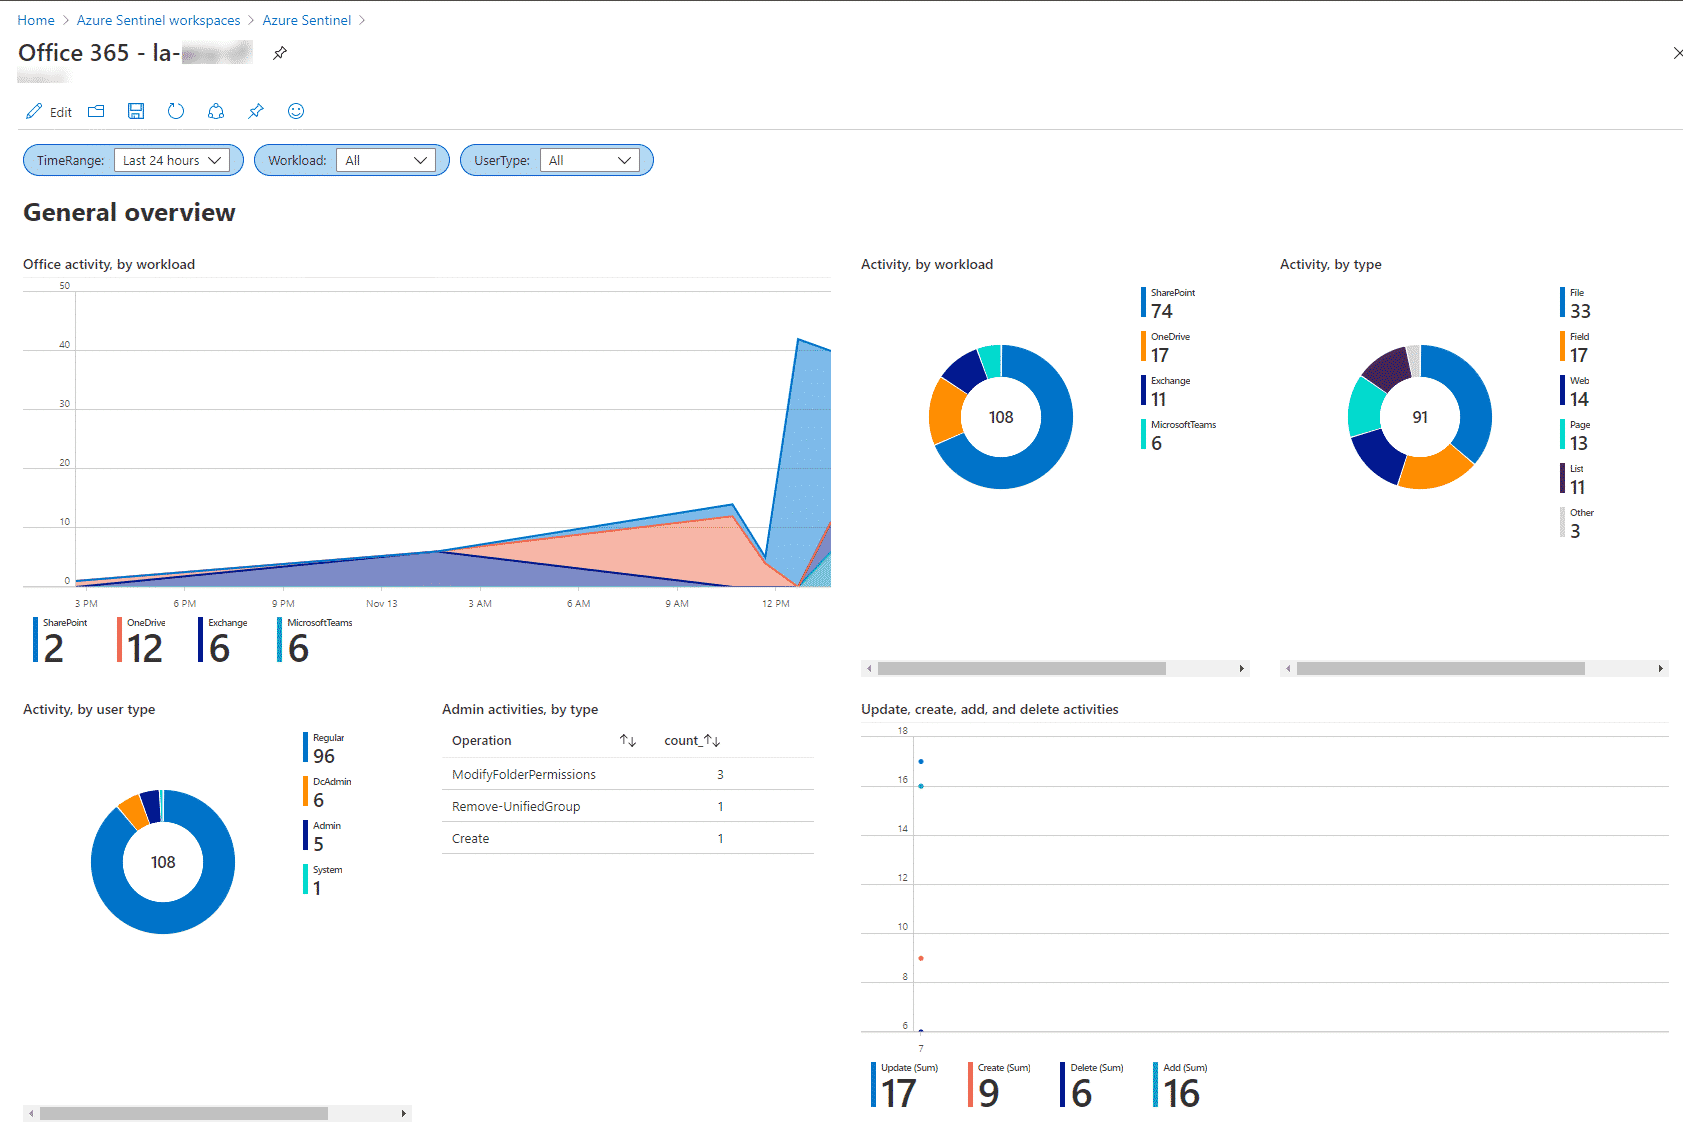
Once the data connector is enabled, you can utilize the Office 365 workbook to get you started with this data:
The Azure team also provides various hunting queries for Office 365 data types:
https://github.com/Azure/Azure-Sentinel/tree/master/Hunting%20Queries
One thing we found a little lacking in Sentinel was a way to ingest Email data.
For this post, the Splunk Microsoft Office 365 Reporting Add-On ( https://splunkbase.splunk.com/app/3720/ ) was used to collect email data; namely Subject and Sent/Received data.
Our friend Josh Rickard built a container for periodically scraping Exchange logs and generating a JSON file which can be ingested into Sentinel:
https://github.com/MSAdministrator/mailtrail
But if anyone from Microsoft is reading (hah!) it would be great if there was an easier way to get Office 365 Email data into Sentinel, including DKIM information, attachment details/size as well as sender/receiver information. Pretty please!
Conclusion
The aim of this post was to highlight some use-cases for Office 365 telemetry. We looked at some common operations that users perform and how those these can be queried through Office 365 telemetry and took a quick look at how this telemetry can be used to detect malicious activity occurring on your Office 365 tenant. If you are utilizing Office 365 and do not have eyes on the telemetry that is produced by your tenant, we hope that this blog post serves as a gentle nudge to get these logs ingested and operationalized.
Anton is a BSides Toronto speaker, C3X volunteer, and an OSCE, OSCP, CISSP, CSSP certificate holder. Anton enjoys the defensive aspects of cybersecurity and loves logs and queries.